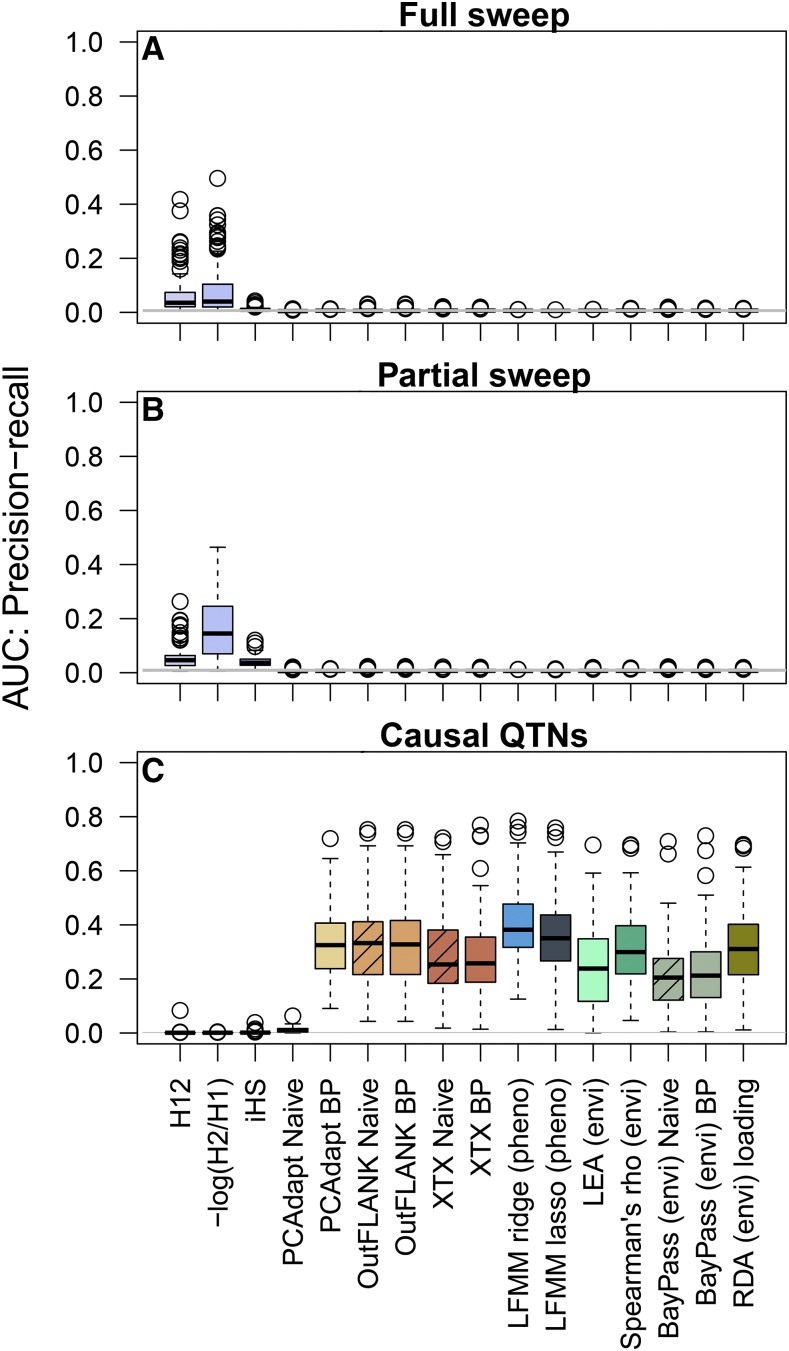
Figure 5.
Area Under the Curve for Precision-Recall (AUC-PR) measures the overall performance of each statistic: AUC = 1 means that all causal loci have larger signals than neutral loci, and an AUC ∼0.01 is expected under random chance (horizontal gray line). A) AUC-PR evaluated in the region of the full sweep (2000 bp on either side). B) AUC-PR evaluated in the region of the partial sweep (2000 bp on either side). C) AUC-PR evaluated at all causal QTNs that explained greater than 1% in the additive genetic variance. Each method is shown in a different color, and the naive practice is shown with hatched bars when applicable.

