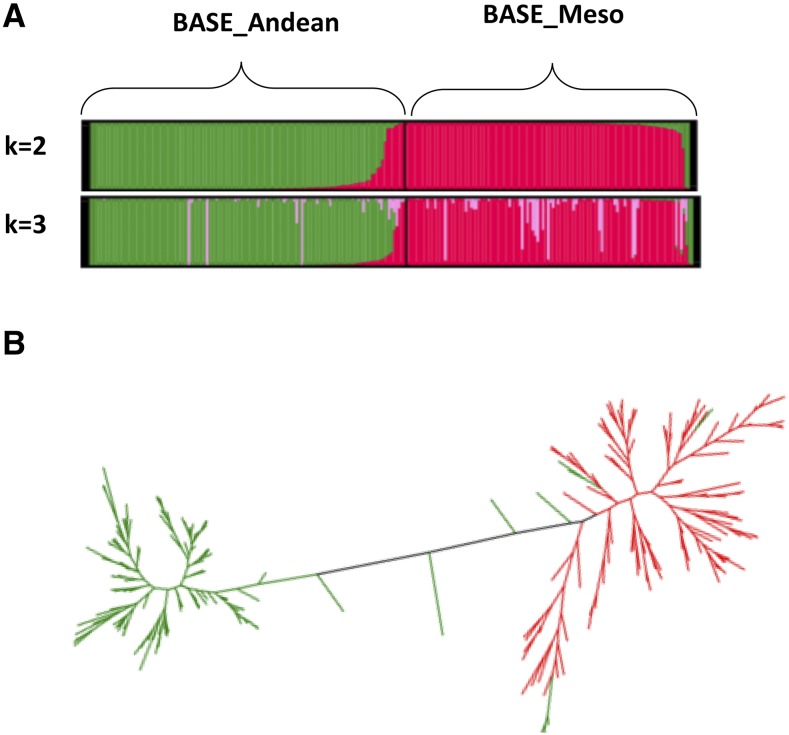
Figure 2.
Relationship among the BASE_Meso and BASE_Andean diversity panels. A. STRUCTURE analysis on 242 BASE genotypes with 125k SNPs. k = 2, was optimum number of subpopulations for the BASE populations. B. ML phylogenetic tree of BASE genotypes. Green are the BASE_Meso genotypes and purple and the BASE_Anjdean genotypes

