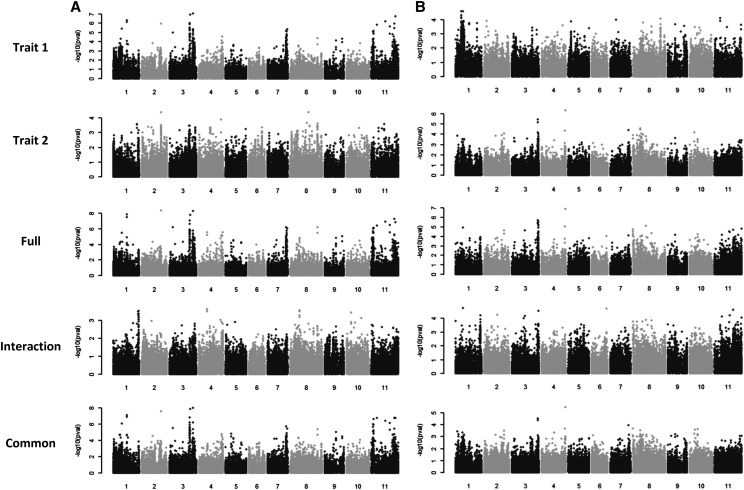
Figure 5.
Multi-trait mixed model GWAS. A. Days to flower in Honduras, (Trait 1) and Puerto Rico (Trait 2) grown in 2016. B. Days to flower (Trait 1) and days to maturity (Trait 2) grown in Puerto Rico in 2016. The full model identifies those SNPs with either an interaction or common effect. The interaction model identifies SNPs that act differentially for the two traits or locations. The common model identifies SNPs that act in the same direction for the two traits or locations. The P value cutoff for the two GWAS, as determined using the Bonferroni test based on the effective number of SNPs was –log10(P)=4.10.

