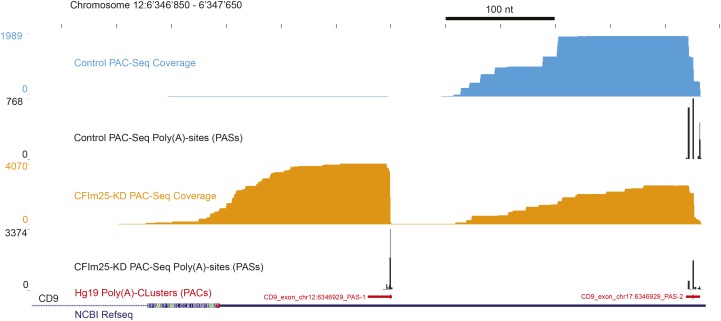
Figure 2.
Read coverage and the detected poly(A) sites (PASs) over the CD9 gene for two samples of Poly(A)-ClickSeq analysis of mocked treated HeLa cells (blue) and CFIm25 siRNA treated HeLa cells (orange) are depicted. Poly(A)-Clusters (PACs) are illustrated as a track (red) in the UCSC genome browser. The most frequently detected poly(A)-site within the poly(A)-cluster is highlighted as the thicker portion of the whole poly(A)-cluster in the track.

