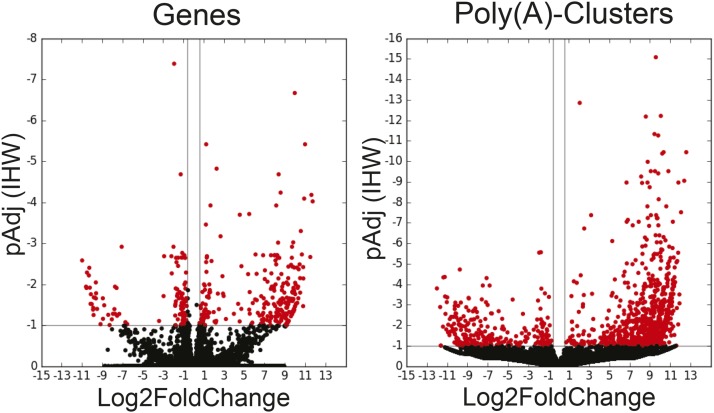
Figure 3.
Volcano plots of the differential expression of Genes (left) and Poly(A)-Clusters (right) in HeLa cells upon siRNA KD of CFIm25 using default settings of DPAC (data from Table 2, column 1). Red dots indicate genes or PACs with a fold changes greater than 1.5 and a p-adjusted value less than 0.1.

