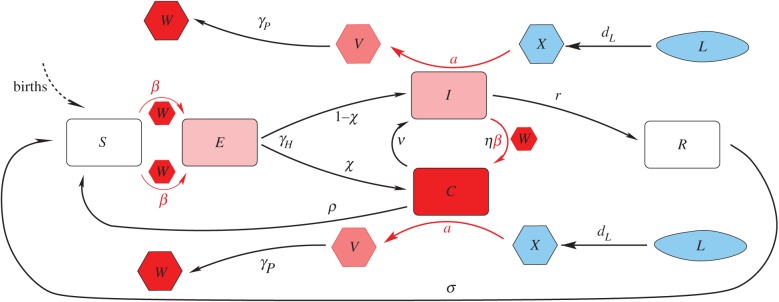
Figure 1.
The human–mosquito SECIR–LXVW coupled model. The human stages of infection ‘SECIR’ are depicted in the central part of the figure progressing from S to E to I from left to right. The different stages of the mosquito population, from larva (L) to infectious adult mosquito (W), are drawn in the upper and bottom of the figure progressing from uninfected L, larvae and adults (blue) to incubating (pink) and infected adults (red), from right to left (LXVW). Per capita death rates (respectively, δH and δM, and δL in the equations) affect all mosquito and human classes, and for simplicity are not included in the diagram. (Online version in colour.)

