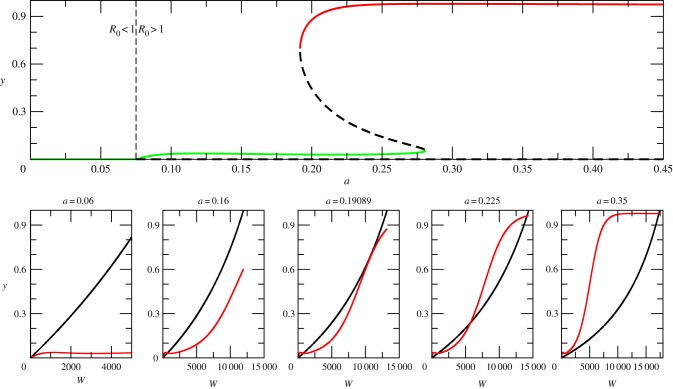
Figure 2.
Relationship between saddle-node bifurcation and mosquito biting rates. When biting rates are low, the curves intersect at zero and malaria fails to establish, resulting in a disease-free equilibrium (R0 < 1). As the biting rate a increases, the two curves intersect initially at one single point (a = 0.16) corresponding to a stable endemic equilibrium. When the biting rate crosses a critical value (aC = 0.19089), a tangential bifurcation arises. Further increases of the biting rate end up producing two alternative stable states corresponding to the coexistence of two endemic equilibria characterized by high and low malaria incidence (aC < a < 0.28). Eventually, only the upper equilibrium is left (a > 0.28). The full bifurcation diagram shown in the upper plot is calculated with parameter combination A (but with βe = 0; see electronic supplementary material, table S1). It represents a cross section of figure 4b following the horizontal broken line shown there (but here starting at a = 0 rather than at a = 0.15) for incremental increases in biting rate. (Online version in colour.)

