Figure 4.
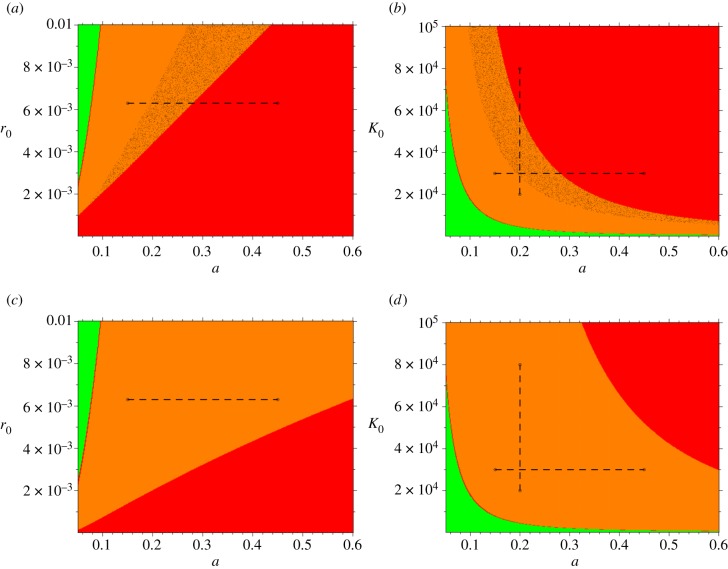
Dynamic regimes. Relationship between key parameters in the model and the emergence of bifurcations. In all cases, the x-axis depicts the biting rate a and the y-axis, either the basal recovery rate r0 (a,c) or the carrying capacity K0 (b,d). The coloured regions delineate different domains of dynamics behaviour. The orange regions correspond to non-trivial disease equilibria that are locally stable and are approached with damped oscillations. Within these regions, two stable equilibria coexist in the shaded area (panels (a) and (b)). The red regions correspond to stable endemic equilibria that are approached with no oscillations. The green regions represent the region of parameter space where the system exhibits global disease-free equilibria. The fraction of infectious humans exhibits a bifurcation in the section illustrated by the broken lines in the upper panels. These lines cross a region where a single-stable equilibrium gives rise to two coexisting stable equilibria as the value of either of the bifurcation parameters increases (see also figure 5c and electronic supplementary material, figure S2, panel d). The lower panels present phase diagrams for the same model structure and parameter combinations but without superinfection (parameter combination A, with βe = 0, from electronic supplementary material §1, table S1). These panels are representative of the more widely used model, whose rates of recovery (r = r0) and loss of immunity (σ = σ0) are constant. Clearly, these simplifications fail to capture the tipping points and multiple equilibria seen in the upper figures.

