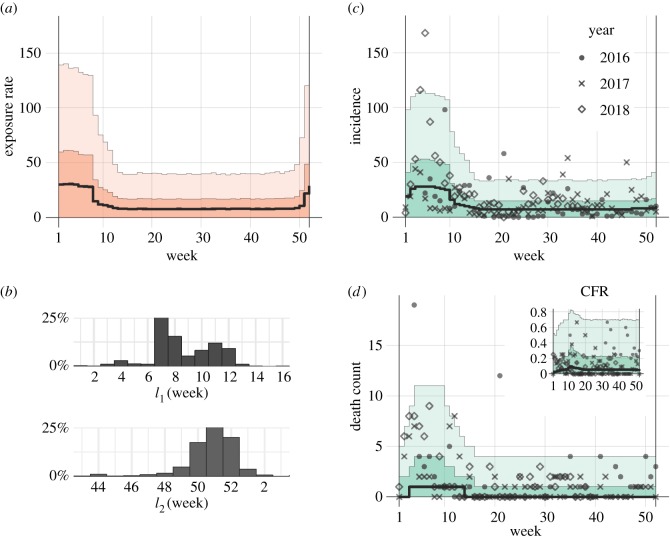
Figure 1.
Temporal distribution of Lassa fever incidence in Nigeria, 2016–2018. (a) Fitted exposure rate as a function of the calendar week in a given year. (b) Posterior distribution for the time boundaries of high-/low-risk exposure periods. (c,d) Model fit to the observed data of new cases and fatal cases. Inset in (d) shows the expected case fatality risk (CFR). Solid black line indicates the median estimate, whereas light and dark shaded areas in (a,c,d) indicate 95 and 50% credible intervals for posterior estimates, respectively. (Online version in colour.)

