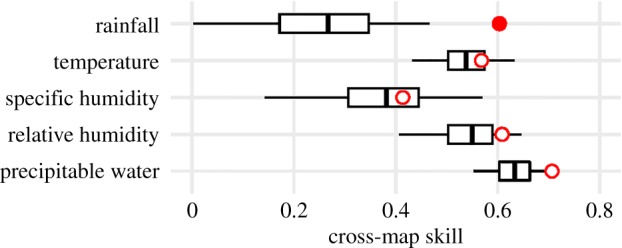
Figure 2.

Cross-map causality for shared seasonality of environmental variables with the Lassa fever incidence. Red circles show the unlagged cross-map skill. Box-plots show null distributions for cross-map skill expected from random surrogate time series that share the same seasonality as the true environmental variable. The single filled circle indicates that the measured causality is significantly better than the null expectation (p < 0.01). As for the use of convergent cross-mapping, please see literature [20,21]. (Online version in colour.)
