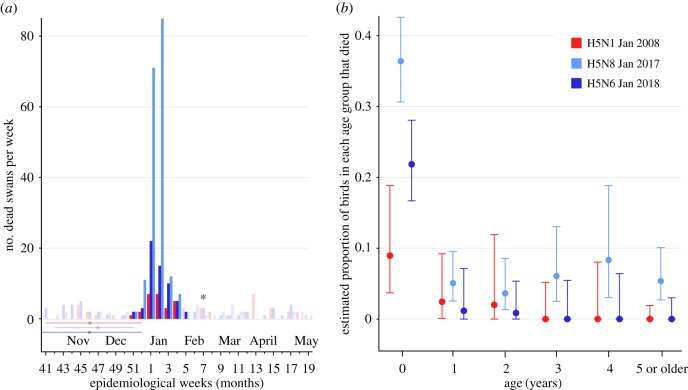
Figure 1.
Mortality among swans on the Fleet Lagoon. (a) Mortality among swans greater than approximately four months old on the Fleet Lagoon during H5N1 (2007/08), H5N8 (2016/17) and H5N6 (2017/18). Brightly coloured bars indicate the number of dead swans observed during HPAIV ‘outbreak periods’ on the Fleet Lagoon (period between the first and last confirmed positive cases in swans at the site for each HPAIV subtype). Brightly coloured bars include all mortality observed during the outbreak period, regardless of whether the carcasses were tested for AIV or AIV positivity. Pale-coloured bars indicate the mortality observed among birds on the Fleet Lagoon in periods when HPAIV was not detected, and therefore indicate the typical level of mortality observed among swans on the Fleet Lagoon. While the last HPAIV H5N1-positive swan was found in the vicinity of the Fleet Lagoon during week 4 of 2008, a Canada goose (Branta canadensis) was found positive for HPAIV less than 1 km from the Fleet Lagoon during week 7 of 2008 and is marked with an asterisk. Dots and horizontal lines indicate the median and 95% HPD interval dates for the MRCA of the Fleet Lagoon outbreak clade, as estimated using phylodynamic methods. (b) Estimated proportion of birds of each age group that died of HPAIV infection during each outbreak, based on birds believed to be alive in the population at the time each outbreak started. Colours indicate the respective outbreaks. Adjusted Wald 95% confidence intervals are given.

