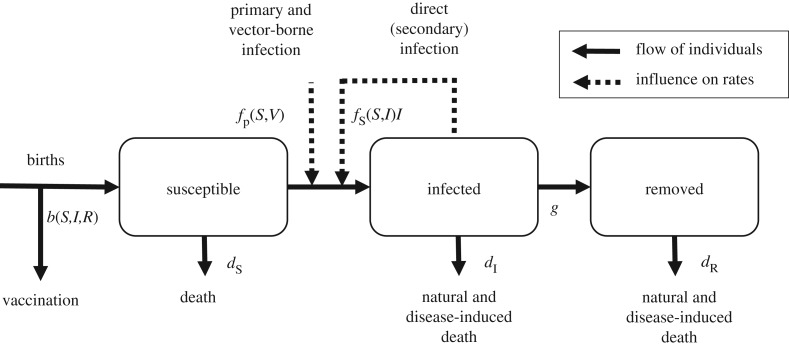
Figure 2.
A basic SIR model with primary and secondary infections, births, deaths, culling and natural and disease-induced death, as represented in equation (3.1). Solid arrows represent the flows of individuals between classes within the population (S, susceptible; I, infected; R, removed/recovered). Dashed lines represent the dependence of the infection rate on external and internal factors. Vaccination at birth effectively removes a proportion of individuals before they enter the population.

