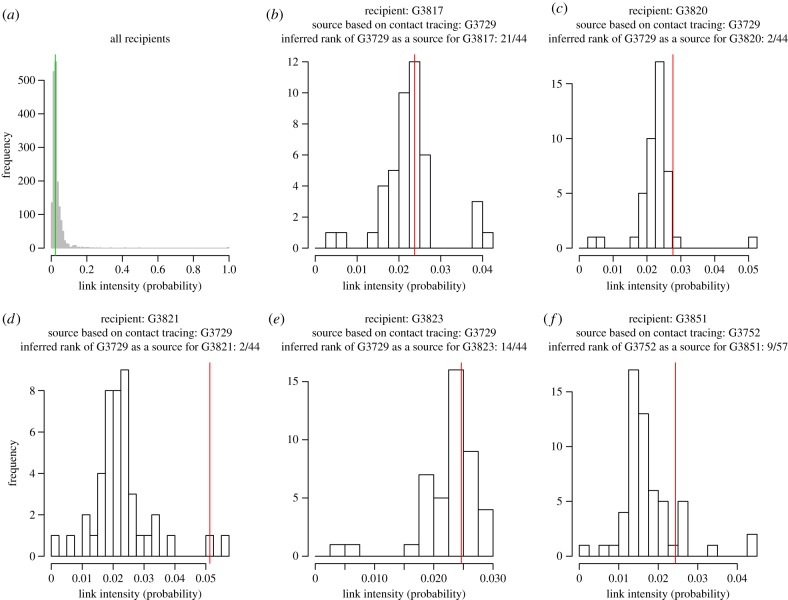
Figure 2.
Estimated intensities of links for all recipients (a; vertical line: median intensity) and for each recipient in the training set of hosts (b–f; vertical lines: intensity for the source identified with contact tracing). This figure was obtained from the combined analysis of 31 sequence fragments and with cross-validation. Analogous figures obtained without cross-validation and with half of the fragments are given in electronic supplementary material, figures S6–S8. The second half of fragments led to approximately the same results for training hosts. Note in addition that using only one fragment for inferring transmissions led to particularly stochastic outputs. (Online version in colour.)

