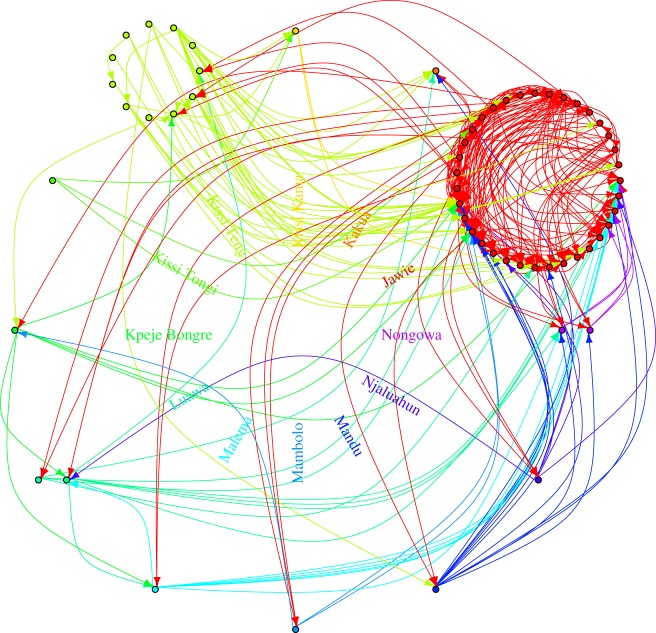
Figure 3.
Most likely epidemiological links cumulating to 20% probability for each recipient (i.e. for each recipient, potential donors were ranked with respect to link intensity, and the subset of donors with higher ranks for whom the sum of link intensities reached 0.2 were displayed on the graph). (Online version in colour.)

