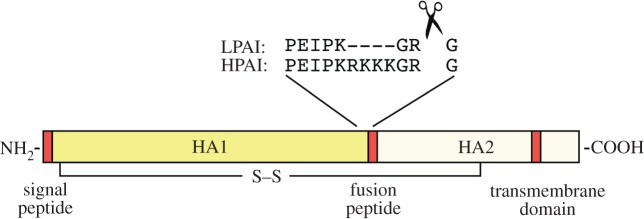
Figure 2.
Cartoon depicting post-translational processing of a linear HA monomer. HA1 and HA2 domains are indicated, as is the linking disulfide bridge. Red boxes indicate hydrophobic regions involved in membrane interactions. Example cleavage sequences from low and high pathogenicity H5 viruses are shown.

