
Figure 2.
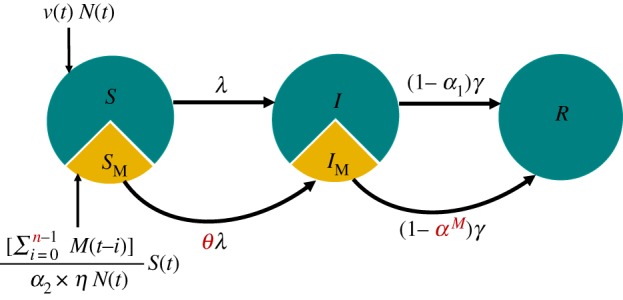
Schematic of the whooping cough transmission model. Individuals progress from compartments S to I and I to R at rates of λ and γ, respectively. Individuals recently infected with measles progress from compartments SM to IM and IM to R at rates of θλ and γ, respectively. Disease-induced mortality owing to whooping cough and measles are represented by α1 and α2, respectively. Here, M(t) is number of measles cases at week t. Immune mediation parameters are coloured red; θ quantifies the susceptibility to whooping cough after measles infection, αM represents the risk of disease-induced mortality owing to whooping cough after measles infection, and n is the immune modulation duration. The slice size does not represent the actual size of SM.