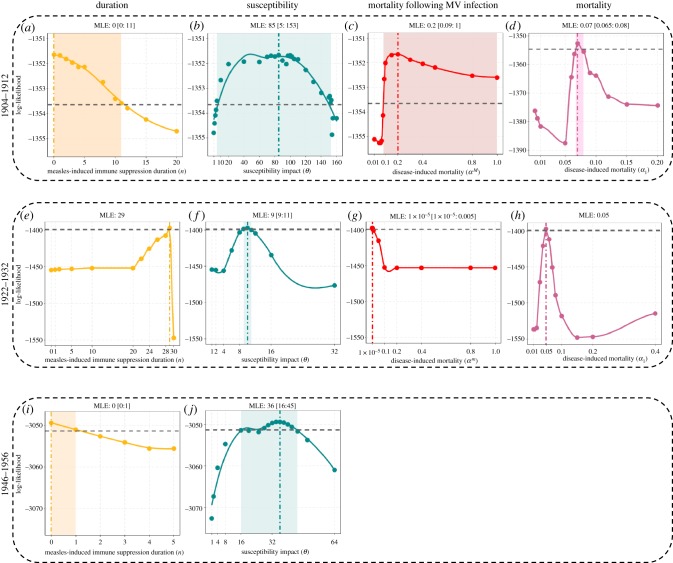
Figure 3.
Log-likelihood profiles for parameters n, θ, αM and α1 for eras 1904–1912 (a–d), 1922–1932 (e–h), 1946–1956 (i,j) in London. The profiles are constructed by fitting a smooth curve through the log-likelihood points. Vertical dashed dotted lines represent the maximum-likelihood estimate (MLE). The horizontal dashed lines represent the approximately 2 log-likelihood units below the MLE. The shaded areas represent the estimated 95% confidence interval.

