
Figure 1. Molecular alterations targeted by matched therapies and impact of the Matching Score on treatment outcome.
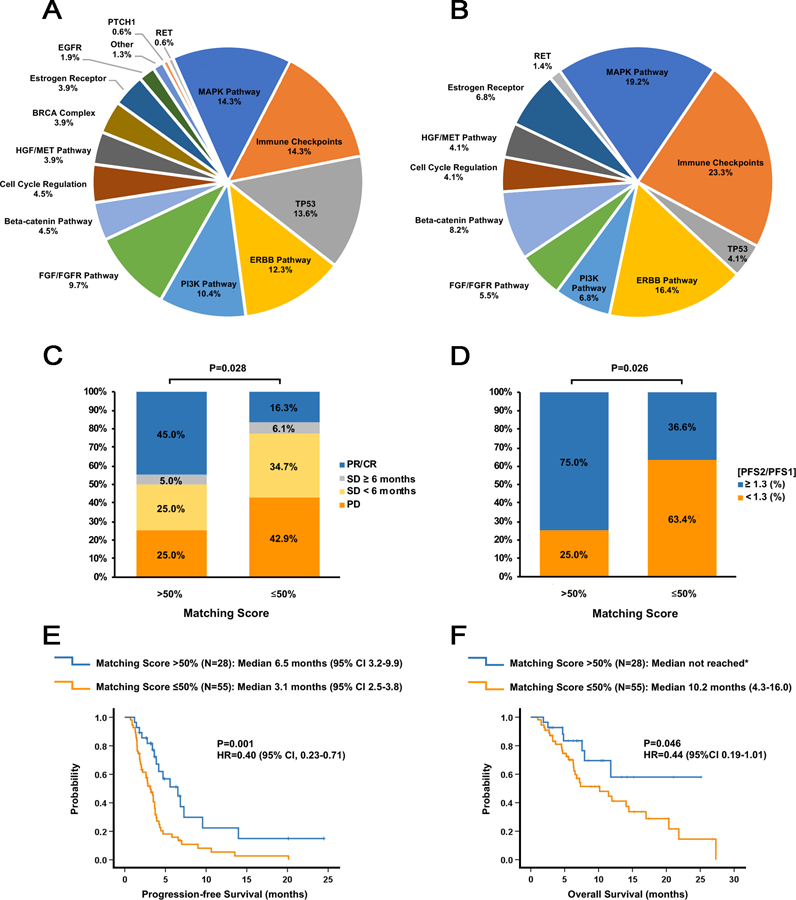
A. Pie graph of the percentage of actionable aberrations in the indicated targets or target pathways for the 73 patients who received at least one matched drug. Since some patients had alterations targeted in multiple genes or pathways, the percentages do not add up to 100%. “Immune checkpoints” refers to amplification of the CD274 (PD-L1) and/or PDCD1LG2 (PD-L2) genes, positive PD-L1 expression (immunohistochemistry), high/intermediate tumor mutational burden, or high microsatellite instability; “MAPK pathway” refers to alterations in the KRAS, BRAF, GNAS, MEK1, NF2 or JAK2 genes; “ERBB pathway” refers to alterations in the ERBB2 or ERBB3 genes; “PI3K pathway” refers to alterations in the AKT1, AKT2, PIK3CA, PIK3R1 or PTEN genes; “FGF/FGFR” pathway refers to alterations/amplifications in the FGFR1/2/3, FGF3, FGF4, FGF6, FGF19, FGF23 or FRS2 genes; “Beta-catenin pathway” refers to alterations in the APC, CTNNB1 or FAT1 genes; “Cell cycle regulation” refers to alterations in the CDKN2A/B, CCND1/2 or CDK4/6 genes; “HGF/MET pathway” refers to alterations in the HGF or MET genes; “BRCA complex” refers to alterations in the BRCA1, BRCA2, ATM, BRIP or PALB2 genes; Estrogen receptor” refers to alterations in the ESR1 gene or estrogen receptor (ER) positivity as assessed by immunohistochemistry; “Other” refers to alterations in the MYC or EWSR1 genes. TP53, EGFR, PTCH1, and RET refer to alterations in the genes encoding these proteins.
B. Pie graph of the percentage of actionable aberrations in the indicated targets or target pathways for the 28 patients who had a Matching Score >50%. In these 28 patients, a total of 67 molecular alterations were matched to treatments.
C. Bar graph analyzing the percentage of patients with SD ≥6 months, partial response (PR), and complete response (CR) for patients with a Matching Score of ≤50% (N=49) versus >50% (N=20). P-values were computed using a binary logistic regression test.
D. Bar graph analyzing the percentage of patients with a PFS ratio ≥1.3 versus PFS<1.3 for patients with a Matching Score of ≤50% (N=49) versus >50% (N=20). P-values were computed using a binary logistic regression test.
E. Kaplan-Meier curves display progression-free survival (PFS) for patients with a Matching Score ≤50% (N=55) versus >50% (N=28). P-values are from the log-rank test (two-sided)
F. Kaplan-Meier curves display overall survival (OS) for patients with a Matching Score ≤50% (N=55) versus >50% (N=28). P-values are from the log-rank test (two-sided). *Median OS not reached after a median follow up of 8.5 months.