Supplemental Digital Content is available in the text.
Background.
High intrapatient variability (IPV) of tacrolimus (Tac) is increasingly recognized as a risk factor for poor graft outcomes in kidney transplantation. The timing of onset of its impact on kidney histologic lesions has not been investigated.
Methods.
We analyzed the adverse effect of Tac IPV using the coefficient of variability from 6 to 12 months posttransplantation on long-term outcomes in a cohort of 671 kidney recipients and on the evolution of chronic histologic lesions in a cohort of 212 recipients for whom paired protocol biopsies at 10 days and 1 year were available.
Results.
High IPV of Tac (cutoff value of coefficient of variability = median of 20.5%) was associated with an increased risk of graft loss (hazard ratio, 3.28; 95% confidence interval, 1.090–9.849; P = 0.035) in the entire cohort. At 1 year, the high Tac IPV group showed a significantly deteriorated chronicity score (F = 5.912, P = 0.016) compared with the low Tac IPV group in the Histology cohort after controlling for the 10-day scores. In a multivariate analysis, a high IPV of Tac was predictive of the chronicity score (odds ratio, 1.91; 95% confidence interval, 0.215–1.075; P = 0.003) at 1 year posttransplant.
Conclusions.
These data indicate that high IPV of Tac is associated with early deterioration of chronic histologic lesions as well as poorer long-term outcomes. Large prospective studies of Tac IPV usage as a clinical monitoring tool are needed in the future.
Tacrolimus (Tac) is widely used as a foundation of immunosuppressive therapy for renal transplant recipients (RTRs). Since its introduction in the early 1990s, significant improvement in short-term outcomes has been observed, while long-term survival of kidney allografts remains relatively stagnant.1-4 Tac has a narrow therapeutic window and significant variability in its pharmacokinetics in the general population.5 Tac has a typical concentration-effect relationship, and therefore Tac doses are routinely determined by therapeutic drug monitoring to reach predefined target concentrations.6-12
A further complication of Tac usage in clinics is that the Tac trough concentration within an individual patient often fluctuates considerably over time. This intrapatient variability (IPV) may be related to biological causes, such as changing hematocrit, liver dysfunction, and diarrhea, changes in concomitant medications, and CYP3A4 activity—altering food intake but also has been reported to be strongly associated with medication nonadherence.13-15 Regardless of the cause of the IPV, studies have shown that IPV in Tac concentration is clearly correlated with poor graft and patient outcomes. Borra et al16 first reported the importance of Tac IPV in outcomes of kidney transplantation. In this study, a high Tac IPV (cutoff value: median of 14.9%) between 6 and 12 months posttransplantation was significantly correlated with a composite endpoint of graft failure in the subsequent 12 months. In a previous study, we have also shown that RTRs with a high IPV of Tac had a significantly higher risk of a biopsy-proven acute rejection than patients with a low Tac IPV (odds ratio [OR], 2.655; 95% confidence interval [CI], 1.394–5.056; P = 0.003).17 Others have reported associations of a high Tac IPV with late allograft rejection, the coexistence of human polyomavirus 1 nephropathy and acute rejection, the development of donor-specific antibodies, and graft loss.18-20 The clinical importance of high Tac IPV has also been reported in pediatric kidney transplant patients as well as adult liver recipients.21,22
However, few studies have investigated the association of a high IPV with the evolution of histologic changes of kidney allografts. This prompted us to investigate how early histologic changes develop in patients with a high Tac IPV. Using paired protocol biopsies at 10 days and 1 year after transplantation, the relationship of Tac IPV with the evolution of histologic lesions was assessed.
MATERIALS AND METHODS
Study Population
This was a retrospective single-center cohort study. RTRs who were transplanted at Seoul National University Hospital, Korea, between January 2007 and December 2014 were analyzed. For the entire cohort, inclusion criteria were (1) age ≥18 years; (2) recipients of single kidney transplantation; (3) recipients treated with twice-daily Tac formulation (Prograf, Astellas Pharma) for >1 year after transplantation; and (4) availability of 3 or more Tac trough concentrations between 6 and 12 months posttransplantation to calculate the coefficient of variability (CV). Only outpatient Tac concentrations from whole blood taken just before the morning dose were considered for analysis. Erroneously, high Tac concentrations resulting from taking morning doses before blood sample was collected were excluded. Recipients with donor-specific antibody or positive flow cytometry crossmatch at the time of transplantation and ABO-incompatible transplantation were excluded. For the Histology cohort, recipients with paired protocol biopsies at 10 days and 1 year posttransplantation were selected from the entire cohort. Estimated glomerular filtration rate (eGFR) was calculated using the modified modification of diet in renal disease equation.23
This study was conducted in accordance with the Declaration of Helsinki and approved by the Seoul National University Hospital Institutional Review Board (H-1701-117-82). Informed consent was waived for this study by the Board.
Immunosuppression
All patients received a triple immunosuppressive regimen consisting of Tac, mycophenolate mofetil or sodium mycophenolic acid, and steroid with basiliximab induction. The dose of Tac was adjusted to achieve a trough blood concentration of 8–12 ng/mL in the first 3 months, 6–8 ng/mL until 1 year after transplantation, and 4–6 ng/mL thereafter. Nonadherent patients to immunosuppressive medications were detected by reviewing the medical charts. The attending physicians recorded nonadherence if the physician suspected that the patient had not taken medication regularly through inquiry during the outpatient clinic. Tac concentrations were determined using high-performance liquid chromatography tandem mass spectroscopy with a Waters 2795 Alliance HT system (Micromass, Manchester, United Kingdom).24 The intraday CV ranged from 5.2% to 9.3% and the accuracy was from 96.0% to 104.0%. The interday CV varied from 3.6% to 9.6%. The lower limit of quantitation for Tac was 0.8 ng/mL.
Tac IPV
Tac IPV was estimated by calculating the CV according to the following equation: CV (%) = (SD/mean Tac trough concentration) ×100. Mean concentrations were calculated using all outpatient Tac concentrations between 6 and 12 months. Recipients were separated into 2 groups, low IPV and high IPV, according to the cutoff of CV = 20.5% (which is a median value of CV in the entire cohort). The Histology cohort was also divided into 2 groups, H-low IPV and H-high IPV, based on the same cutoff value of CV.
Histology
Kidney allograft biopsies were obtained as per protocol (postoperative day 10 and at 1 y posttransplantation) or when indicated for suspicion of acute rejection. The severity of histologic lesions was semiquantitatively recorded in accordance with the Banff 07 classifications.25 The acute score was defined as the sum of t, i, v, g, and ptc. Microvascular inflammation was defined as the sum of g and ptc. The chronicity score was defined as the sum of ci, ct, cg, cv, ah, and mm. Fibrosis with inflammation was defined as the sum of ci and i. Interstitial fibrosis and tubular atrophy (IFTA) was defined as the sum of ci and ct.
Statistical Analysis
Statistical analyses were performed using the SPSS (version 21.0 for Windows; SPSS Inc., Chicago, IL). The data were expressed as means ± SD values or numbers and percentages. All tests were 2 tailed and differences at P values <0.05 were considered statistically significant. Mean values were compared using Student’s t-test or paired-samples t-test for the variables between both time points. Noncontinuous variables were compared by chi-square test or Fisher exact test. Kaplan-Meier survival analysis was performed to calculate the time to event from transplant and the log rank test was used for comparison. Recipients with acute rejection and graft failure after 1 year posttransplantation were included in these analyses to prevent reverse causation bias. To examine whether high IPV was a risk factor for graft survival, univariate and multivariate analyses with Cox regression were used. The IPV was analyzed as a dichotomous variable as well as a continuous variable. To test the hypothesis that lower Tac exposure with high IPV would have more significant impact on graft survival, interaction term of IPV and mean Tac concentration subgroup was added as a covariate in the multivariate Cox regression model. The mean Tac concentration subgroup was defined by using the quartiles of mean Tac concentration between 6 and 12 months after the transplantation. For the Histology cohort, a one-way ANCOVA was conducted to determine a statistically significant difference between IPV groups on histologic scores at 1 year, controlling for scores at 10 days. To analyze the effect of IPV on the progression of histologic scores, independent factors with P <0.2 in univariate analysis were entered into a multivariate linear regression model using a stepwise selection method. To prevent Type 1 error inflation, 6 different chronic outcome variables were tested at an alpha level of 0.0083 (0.05 ÷ 6). The factors included in univariate and multivariate analyses were donor age, donor sex, donor type (living or deceased donor), primary kidney disease, panel reactive antibody level, recipient age, recipient sex, preemptive transplantation, retransplant, cold ischemic time, warm ischemic time, occurrence of biopsy-proven acute rejection, total combined mismatch of human leukocyte antigen-A, -B, and –DR, concomitant use of mycophenolate, mean Tac trough concentration, individual histologic scores at 10-day biopsies, and IPV groups.
RESULTS
Entire Cohort
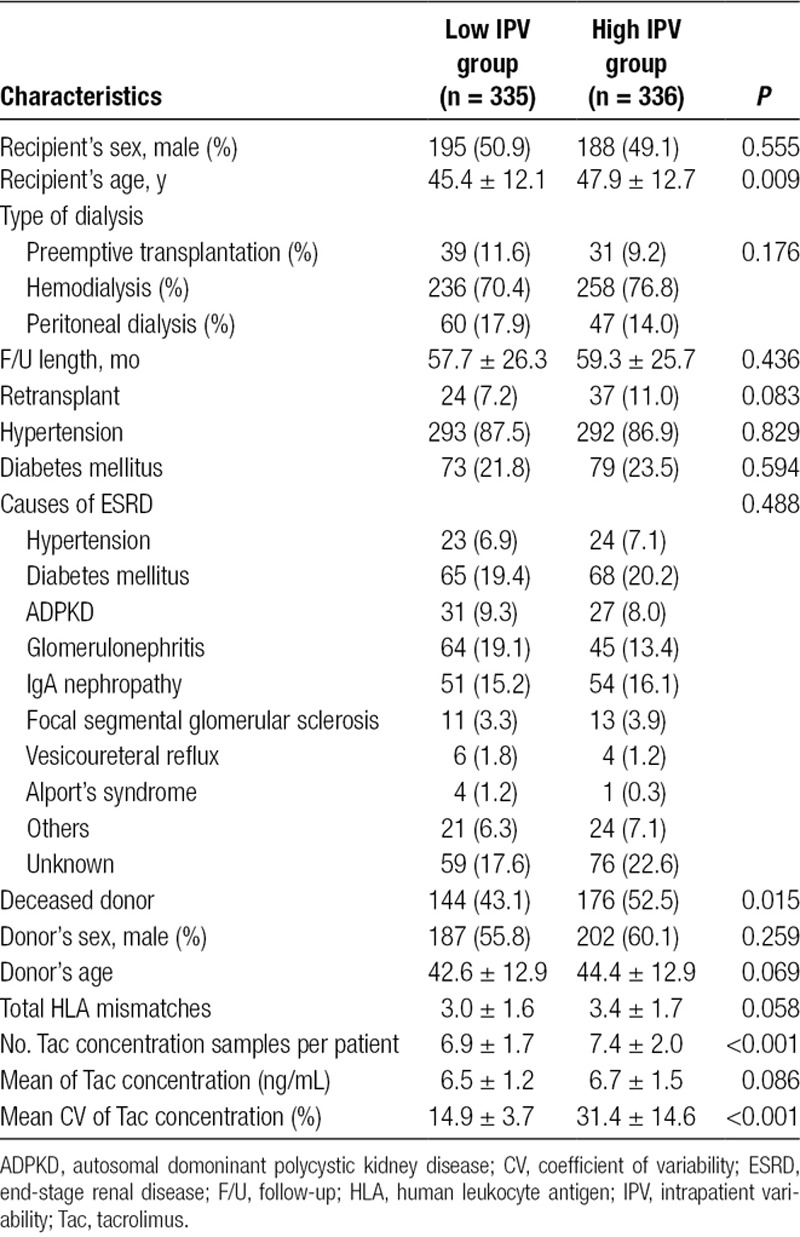
Among 1000 recipients who had received renal transplantation during the study period, 671 recipients were included in this study as the entire cohort. Those recipients who were younger than 18 years (n = 134), received multiorgan transplants (n = 51), received ABOi or donor-specific antibody (DSA) (+) transplants (n = 36), used generic Tac formulation (n = 105), and had graft failure or death within 1 year after transplantation (n = 3) were excluded. The mean follow-up of the entire cohort was 58.5 ± 26.0 months. The baseline characteristics of the entire cohort are summarized in Table 1. Distribution of CV of Tac for outpatient trough concentrations is shown in Figure S1, SDC, http://links.lww.com/TXD/A210. The median of CV was 20.5% and recipients were divided into either the low IPV group (CV < 20.5%) or high IPV group (CV ≥ 20.5%). Mean CV was 14.9 ± 3.7% in the low IPV group and 31.4 ± 14.6% in the high IPV group (P < 0.001). Mean Tac concentrations in these groups were 6.5 ± 1.2 and 6.7 ± 1.5 ng/mL, respectively (P = 0.086). The number of outpatient Tac concentration blood samples in the study period was 6.9 ± 1.7 in the low IPV group and 7.4 ± 2.0 in the high IPV group (P < 0.001). In this study, 37 patients had <5 Tac concentrations; 20 (54.1%) out of these patients were in the low IPV group and 17 (45.9%) were in the high IPV group.
TABLE 1.
Baseline demographics and clinical characteristics of the entire cohort
Clinical Outcomes of Entire Cohort
Overall acute rejection-free survival after 1 year posttransplantation was inferior in the high IPV group as compared with the low IPV group at 98.3% and 95.3%, respectively (Log Rank, P = 0.041), as shown in Figure 1. Throughout the follow-up period, 21 recipients (3.1%) lost their kidney grafts. The high IPV group showed significantly inferior graft survival as compared with the low IPV group with a survival of 94.9% and 98.8%, respectively, as shown in Figure 2A (P = 0.006). In multivariate Cox regression analysis, high IPV was a significant risk factor for poorer graft survival (hazard ratio [HR], 3.28; 95% CI, 1.090–9.849; P = 0.035) with acute rejection episodes (HR, 5.456; 95% CI, 2.281–13.050; P < 0.001). Also using the IPV as a continuous variable, multivariate Cox regression analysis demonstrated a 1.9% increase in the hazard of graft failure for every 1% increase of the IPV (HR, 1.019; 95% CI, 1.002–1.036; P = 0.030). There was no effect modification when the interaction term of mean Tac concentration subgroup (group 0: mean Tac concentration ≤ 5.70 ng/mL; group 1: 5.7 < mean Tac concentration ≤ 6.55; group 2: 6.55 < mean Tac concentration ≤ 7.5 ng/mL; group 3: mean Tac concentration > 7.5 ng/ml) and IPV was added as a covariate in the multivariate Cox regression model (P = 0.641). Exclusion of patients with <5 Tac concentrations did not modify the effects of IPV on the development of acute rejection and graft failure (data not shown). Death-censored kidney graft survival analysis showed an inferior survival in the high IPV group (96.7%) compared with the low IPV group (99.1%) with a P value of 0.038 (Figure 2B). There was a trend of difference in the cause of graft loss between groups (P = 0.057). In the low IPV group, 4 recipients lost their graft by antibody-mediated rejection (n = 1), human polyomavirus 1 nephropathy (n = 1), antibiotic nephrotoxicity (n = 1), and death with functioning graft (n = 1). In contrast, the high IPV group showed 17 graft losses with causes including nonadherence to immunosuppressive medication (n = 7), antibody-mediated rejection (n = 3), T-cell–mediated rejection (n = 2), and death with functioning graft (n = 5). There was no statistically significant difference in the patient survival rate between the groups (P = 0.232). During the study period, 2 recipients (0.6%) died of infection in the low IPV group, while 6 recipients (1.8%) in the high IPV group died; causes included malignant disease (n = 3), infection (n = 2), and refusal to initiate dialysis after graft loss (n = 1).
FIGURE 1.
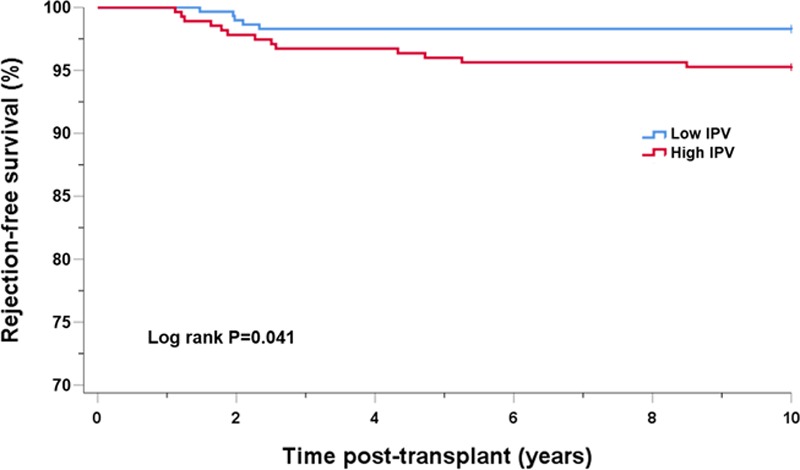
Acute rejection-free survival after 1-y posttransplantation by Tac IPV group in the entire cohort. IPV, intrapatient variability; Tac, tacrolimus.
FIGURE 2.
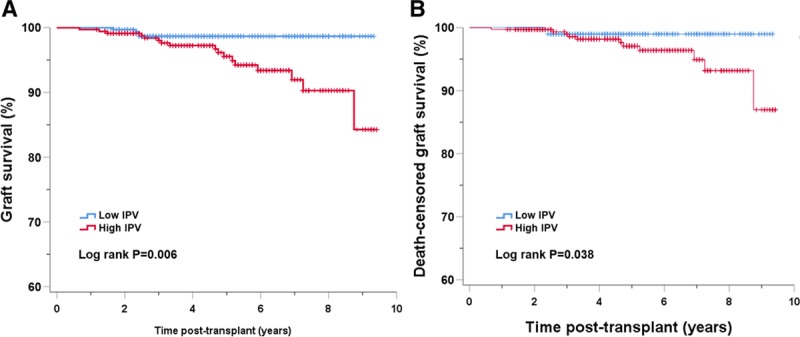
Graft survival (A) and death-censored graft survival (B) by Tac IPV group in the entire cohort. IPV, intrapatient variability; Tac, tacrolimus.
Histology Cohort
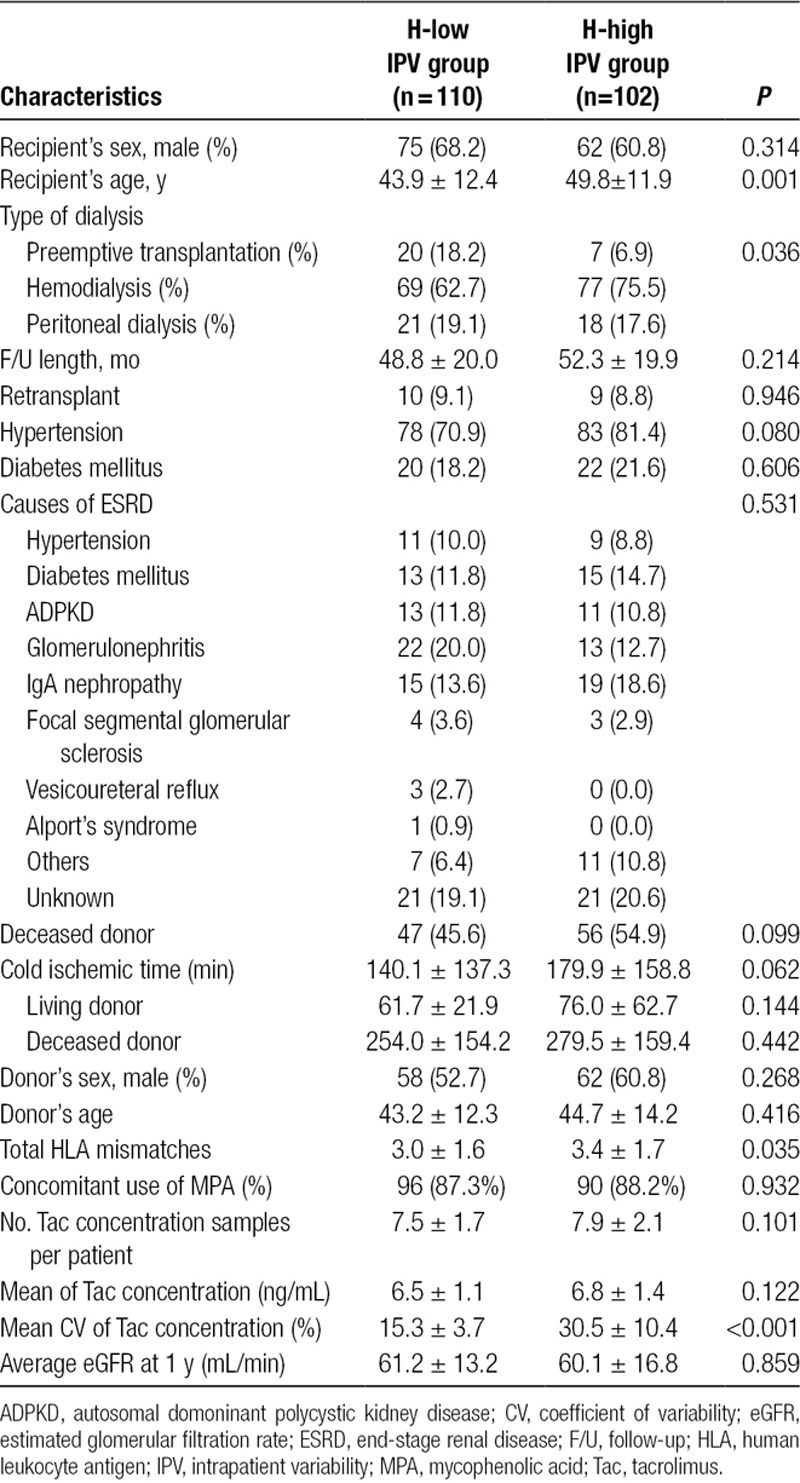
We selected 212 recipients as a Histology cohort for whom paired protocol biopsies at 10 days and 2 years were available to evaluate the correlation of the IPV with the evolution of histological scores. Recipients of the Histology cohort were classified into the H-low IPV (n = 110) and the H-high IPV (n = 102) groups based on the median value of CV of the entire cohort (cutoff value of CV = 20.5%). Table 2 shows the baseline characteristics of the Histology cohort. Patients in the H-high IPV group were older (49.8 ± 11.9 vs 43.9 ± 12.4 y, P = 0.001) and had a higher number of total human leukocyte antigen mismatches (3.4 ± 1.7 vs 3.0 ± 1.6, P = 0.035) than the H-low IPV patients. There were more recipients with preemptive transplantation in the H-high IPV group (P = 0.036). By 1 year, there were no differences in the clinical outcomes between groups in the Histology cohort. There was a similar acute rejection rate by one year (16.7% in the H-high IPV group vs 12.7% in the H-low IPV group, P = 0.443). Average eGFR at 1 year was 61.2 ± 13.2 mL/min for the H-low IPV group and 60.1 ± 16.8 for the H-high IPV group (P = 0.859).
TABLE 2.
Baseline demographics and clinical characteristics of the Histology cohort
Correlation of Histological Scores With Renal Function
At 1 year, as shown in Figure 3, the eGFR was significantly correlated with the calculated chronicity score (R = 0.284; P < 0.001), scores of fibrosis with inflammation (R = 0.276; P < 0.001), scores of IFTA (R = 0.205; P < 0.001), scores of microvascular inflammation (R = 0.178; P = 0.01), scores of vascular intimal thickening (R = 0.151; P = 0.03), scores of arterial hyalinosis (R = 0.172; P = 0.013), and calculated acute scores (R = 0.253; P < 0.001).
FIGURE 3.
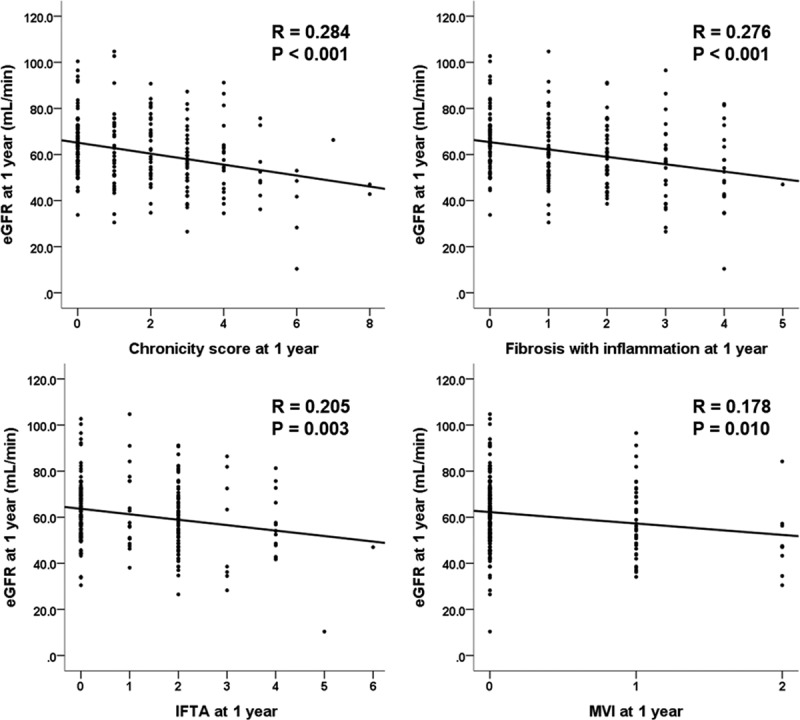
Correlation of histological scores with eGFR at 1 y. eGFR, estimated glomerular filtration rate; IFTA, interstitial fibrosis and tubular atrophy; MVI, microvascular inflammation.
IPV as a Predictor of Aggravation of Histological Scores
As shown in Table 3, the chronic histological scores steadily increased during the first year after transplantation in both groups. As some of the baseline (10 d) chronic scores were significantly higher in the H-high IPV group, ANCOVA analysis was conducted to evaluate the impact of IPV group on the evolution of the scores while controlling for baseline histological scores (Figure S2, SDC, http://links.lww.com/TXD/A210 and Figure 4). There was a significant effect of the H-high IPV group on the progression of ci, ct, mm, chronicity score (F = 5.912; P = 0.016), and IFTA (F = 5.967; P = 0.015) as compared with the H-low IPV group after controlling for baseline scores. The high IPV had a marginal effect on the progression of microvascular inflammation (F = 3.415; P = 0.066) and fibrosis with inflammation (F = 3.527; P = 0.062).
TABLE 3.
Histological scores of the Histology cohort
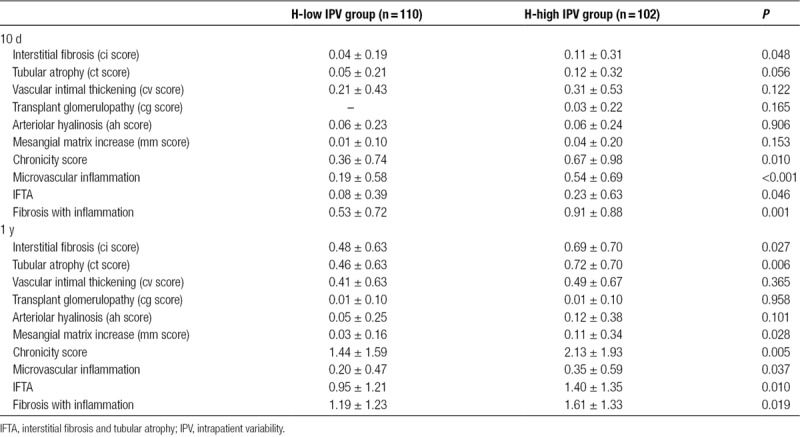
FIGURE 4.
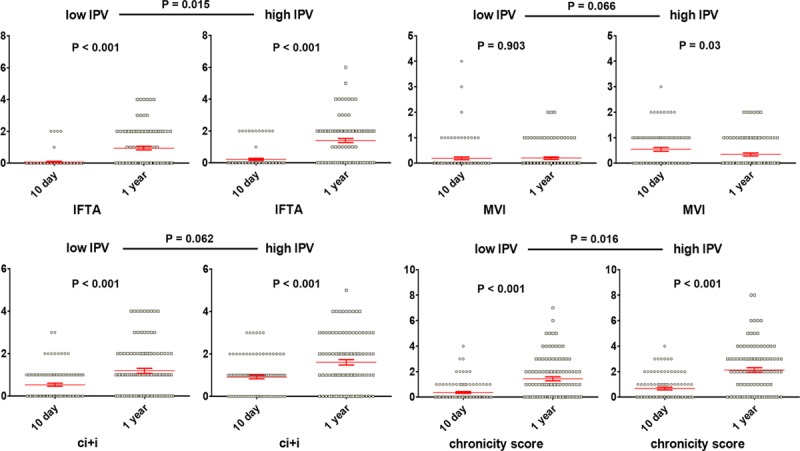
Significant effect of high Tac IPV on the progression of chronic histological scores. Effects of IPV on the progression of histologic scores were compared by ANCOVA for controlling the baseline scores. The mean is plotted with the SEM. IFTA, interstitial fibrosis and tubular atrophy; IPV, intrapatient variability; MVI, microvascular inflammation; SEM, standard error of the mean; Tac, tacrolimus.
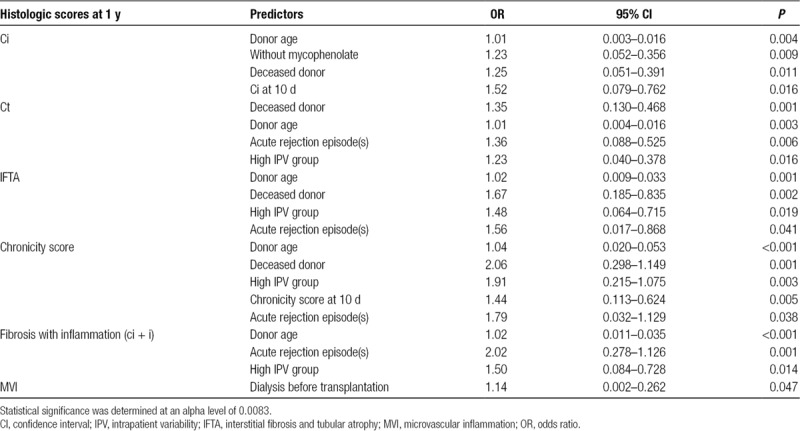
In multivariate linear regression analysis, as shown in Table 4, classification in the H-high IPV group (OR, 1.91; 95% CI, 0.215–1.075; P = 0.003) was an independent predictor of the chronicity score at 1 year along with deceased donor (OR, 2.06; 95% CI, 0.298–1.149; P < 0.001), donor age (OR, 1.04; 95% CI, 0.020–0.053; P < 0.001), and the chronicity score at 10 days (OR, 1.44; 95% CI, 0.113–0.624; P = 0.005). Deceased donor (OR, 1.67; 95% CI, 0.185–0.835; P = 0.002) was predictive of IFTA at 1 year along with donor age (OR, 1.02; 95% CI, 0.009–0.033; P = 0.001). Donor age (OR, 1.02; 95% CI, 0.011–0.035; P < 0.001) and acute rejection episodes (OR, 2.02; 95% CI, 0.278–1.126; P = 0.001) were predictive of fibrosis with inflammation at 1 year.
TABLE 4.
Predictors of chronic scores at 1 y in multivariate linear regression analyses
DISCUSSION
The significance of high IPV of Tac concentrations in long-term transplant outcomes has been frequently reported. Rodrigo et al18 suggested that CV >30% is a risk factor for the occurrence of de novo DSA and is associated with adverse outcomes among RTRs. Sapir-Pichhadze et al20 showed by a time-dependent Cox proportional hazards model that wide fluctuations in Tac concentrations over time are associated with the composite endpoint of late allograft rejection, transplant glomerulopathy, or total graft loss. These adverse effects of high IPV in Tac concentration have been demonstrated even in patients with a “Symphony” style low-dose Tac-based regimen.26 In this study, we confirmed previous observations that high IPV of Tac concentrations adversely impacts graft survival (HR, 3.11; 95% CI, 1.025–9.433; P = 0.045) in a relatively large group of kidney transplant recipients.
With regard to the cause of Tac concentration variability, several mechanisms have been suggested. Food is well known as an important determinant of Tac absorption. Compared to the fasting state, diet significantly reduces the rate of Tac absorption, and a high-fat meal has a greater impact on the rate of Tac absorption than a low-fat/high-carbohydrate meal.27 Therefore, inconsistencies in oral Tac administration with respect to the timing and contents of meals could alter the Tac IPV.28 Concomitant administration of CYP3A4-interfering medications, including herbal products, could also result in inhibition of Tac metabolism and a subsequent increase in Tac area under the curve.29-32 Neuberger et al32 summarized contributors to Tac variability and provided practical recommendations for managing Tac IPV after kidney transplant. Nonadherence with the immunosuppressive drug regimen is considered to be the main cause of high IPV of drug blood concentrations, although there has been no strong evidence of causal relationship.13,20,33,34 In this study, almost half of the graft losses in the high IPV group were attributed to nonadherence to the immunosuppressants, while no graft losses were associated with nonadherence in the low IPV group. This result suggests the important effects of nonadherence in the Tac IPV as well as in graft survival.
The most relevant result of our study was that a high IPV between 6 months and 1 year posttransplantation was predictive of the deterioration of chronic histological score at 1-year protocol biopsies. Although Vanhove et al35 have shown that Tac IPV during months 6–12 after transplantation is predictive of histological deterioration at 2 years without any clinical evidence of renal dysfunction, how early the high IPV worsened kidney histological damage has not been investigated. Although it is well known that chronic histological damage to the transplanted kidney is already prevalent in the first year after transplantation and is associated with inferior graft survival, some studies have not reported identifiable causes of this progressive damage.36-38 In this study, we demonstrated that the high IPV was an independent predictor of the chronicity score (OR, 1.91; 95% CI, 0.215–1.075; P = 0.003). Therefore, we can identify high IPV of Tac during the early posttransplantation period as one of the causes of chronic histological damage of kidney transplants at 1 year. In this respect, the high IPV of Tac can be considered as a predictive marker for the short- and long-term outcomes of kidney allografts.
Lower Tac concentration in the early period after transplantation has been well known as a significant predictor for inferior long-term kidney transplant outcomes.39,40 It has also been suggested that higher Tac IPV during the first 6 months after transplantation is particularly risky in patients with lower Tac blood concentrations due to lower drug exposure.41 Contrary to previous reports, our results show that mean Tac concentration between 6 and 12 months did not modify the adverse impact of the Tac IPV. These results can be explained by the selected study period of Tac IPV in our study from 6 to 12 months after transplantation, which might have less significant adverse impact than the period of immediate posttransplant. Also, our study population was a selected group of patients who survived at least 1 year after transplantation.
IPV monitoring in the outpatient clinic is theoretically desirable as it uses existing Tac trough concentration measurements, thus incurring minimal cost and providing for simplicity of care. However, several questions should be addressed. First, which time period of Tac concentrations should be used? We calculated the IPV of Tac using outpatient Tac trough concentrations between 6 and 12 months as done in other studies.13,14,16,35 This is reasonable because most clinically significant events and drug interventions occur in the early period, Tac concentrations remain stable beyond 6 months, and hospitalized patients may be receiving comedications that could affect Tac absorption and metabolism. Second, how can the cutoff value of Tac IPV to detect patients at risk be standardized? Several parameters, such as the variance (σ2), CV, and mean absolute deviation, have been used for the determination of Tac IPV. Although CV may be the most commonly used parameter in studies of Tac IPV, the superiority of CV over other parameters has never been shown. In addition, the cutoff value of CV that is clinically most relevant and reproducible between study populations should be investigated. Although we used the median of CV for discriminating patients at risk with regard to Tac IPV, others have used the highest tertile values of CV or an ROC curve derived set point of 30% or 40% of CV.18,35,42 A universal cutoff value of Tac IPV to be used to determine high-risk patients would be ideal for clinical care; however, identification of such a value requires robust multicenter, multiethnic, large population studies, and it may not be able to establish such a critical value of Tac IPV above which the risk of adverse transplant outcome increased.39 In the meantime, instead, the Tac IPV could be used as a monitoring tool for potential problems in patient compliance, drug adherence, and drug-drug interactions.
Our study has several limitations. First, our study design is retrospective in nature. We could not identify unreported self-medications. Detection of medication nonadherence was not systematic as well as determination by chart review may significantly underestimate the rate of nonadherence, prohibiting a thorough evaluation of a cause-consequence relationship of nonadherence and high IPV. Second, our study includes generally low-risk kidney recipients. No depleting agent was used for induction and neither DSA nor crossmatch positive patients were included. Therefore, extrapolation of the results of this study to a moderate-to-high–risk patient population requires caution. Third, our study involved a single ethnic (Asian) group in a single center over 8 years. Because genetic polymorphisms impacting drug absorption, distribution, metabolism, and excretion differ between ethnic groups, whether the magnitude of the effect of Tac IPV on histological changes is similar in other ethnic groups should also be evaluated.43 Last, our study involved only a twice-daily formulation of innovative Tac and cannot be extrapolated to the generic formulation of Tac. Given contradictory reports regarding lowering IPV in once-daily Tac formulation,44,45 prospective studies investigating the effect of switching to a once-daily formulation as an intervention for patients with high Tac IPV are warranted.
In summary, high IPV of Tac was predictive of early histological deterioration at 1 year after transplantation in stable RTRs. High IPV of Tac was a significant risk factor for inferior graft survival and lower acute rejection-free survival in kidney transplantation long term. This suggests that high IPV of Tac may lead to chronic histologic lesions in kidney allografts earlier than the onset of renal dysfunction and could be used as a clinical monitoring tool.
Supplementary Material
Footnotes
Published online 22 May, 2019.
H.M. and S.-Y.K. equally contributed to this work. S.M. and J.H. participated in research design; S.-Y.K., H.M., S.M., A.H., S.A., S.-K.M., H.L., C.A., Y.K., and J.H. participated in the performance of the research; S.-Y.K., H.M., S.M., A.H., and S.A. participated in data analysis; H.M., S.-Y.K., S.M., A.H., S.A., S.-K.M., H.L., C.A., Y.K, and J.H. participated in the writing of the paper; all authors approved the final version of the manuscript.
The authors declare no funding or conflicts of interest.
Supplemental digital content (SDC) is available for this article. Direct URL citations appear in the printed text, and links to the digital files are provided in the HTML text of this article on the journal’s Web site (www.transplantationdirect.com).
REFERENCES
- 1.Meier-Kriesche HU, Schold JD, Kaplan B. Long-term renal allograft survival: have we made significant progress or is it time to rethink our analytic and therapeutic strategies? Am J Transplant. 2004;4:1289–1295.. [DOI] [PubMed] [Google Scholar]
- 2.Lamb KE, Lodhi S, Meier-Kriesche HU. Long-term renal allograft survival in the united states: a critical reappraisal. Am J Transplant. 2011;11:450–462.. [DOI] [PubMed] [Google Scholar]
- 3.Ciancio G, Gaynor JJ, Zarak A, et al. Randomized trial of mycophenolate mofetil versus enteric-coated mycophenolate sodium in primary renal transplantation with tacrolimus and steroid avoidance: four-year analysis. Transplantation. 2011;91:1198–1205.. [DOI] [PubMed] [Google Scholar]
- 4.Webster AC, Woodroffe RC, Taylor RS, et al. Tacrolimus versus ciclosporin as primary immunosuppression for kidney transplant recipients: meta-analysis and meta-regression of randomised trial data. BMJ. 2005;331:810. [DOI] [PMC free article] [PubMed] [Google Scholar]
- 5.Macphee IA, Fredericks S, Tai T, et al. Tacrolimus pharmacogenetics: polymorphisms associated with expression of cytochrome p4503a5 and P-glycoprotein correlate with dose requirement. Transplantation. 2002;74:1486–1489.. [DOI] [PubMed] [Google Scholar]
- 6.van Hooff JP, Christiaans MH, van Duijnhoven EM. Tacrolimus and posttransplant diabetes mellitus in renal transplantation. Transplantation. 2005;79:1465–1469.. [DOI] [PubMed] [Google Scholar]
- 7.Ekberg H, Tedesco-Silva H, Demirbas A, et al. ; ELITE-Symphony Study. Reduced exposure to calcineurin inhibitors in renal transplantation. N Engl J Med. 2007;357:2562–2575.. [DOI] [PubMed] [Google Scholar]
- 8.Mallat SG, Tanios BY, Itani HS, et al. CMV and BKPyV infections in renal transplant recipients receiving an mtor inhibitor-based regimen versus a CNI-based regimen: a systematic review and meta-analysis of randomized, controlled trials. Clin J Am Soc Nephrol. 2017;12:1321–1336.. [DOI] [PMC free article] [PubMed] [Google Scholar]
- 9.Marcén R. Immunosuppressive drugs in kidney transplantation: impact on patient survival, and incidence of cardiovascular disease, malignancy and infection. Drugs. 2009;69:2227–2243.. [DOI] [PubMed] [Google Scholar]
- 10.Wiebe C, Gibson IW, Blydt-Hansen TD, et al. Evolution and clinical pathologic correlations of de novo donor-specific HLA antibody post kidney transplant. Am J Transplant. 2012;12:1157–1167.. [DOI] [PubMed] [Google Scholar]
- 11.Staatz CE, Tett SE. Clinical pharmacokinetics and pharmacodynamics of tacrolimus in solid organ transplantation. Clin Pharmacokinet. 2004;43:623–653.. [DOI] [PubMed] [Google Scholar]
- 12.Au E, Wong G, Chapman JR. Cancer in kidney transplant recipients. Nat Rev Nephrol. 2018;14:508–520.. [DOI] [PubMed] [Google Scholar]
- 13.Shuker N, van Gelder T, Hesselink DA. Intra-patient variability in tacrolimus exposure: causes, consequences for clinical management. Transplant Rev (Orlando). 2015;29:78–84.. [DOI] [PubMed] [Google Scholar]
- 14.Goodall DL, Willicombe M, McLean AG, et al. High intrapatient variability of tacrolimus levels and outpatient clinic nonattendance are associated with inferior outcomes in renal transplant patients. Transplant Direct. 2017;3:e192. [DOI] [PMC free article] [PubMed] [Google Scholar]
- 15.Hsiau M, Fernandez HE, Gjertson D, et al. Monitoring nonadherence and acute rejection with variation in blood immunosuppressant levels in pediatric renal transplantation. Transplantation. 2011;92:918–922.. [DOI] [PubMed] [Google Scholar]
- 16.Borra LC, Roodnat JI, Kal JA, et al. High within-patient variability in the clearance of tacrolimus is a risk factor for poor long-term outcome after kidney transplantation. Nephrol Dial Transplant. 2010;25:2757–2763.. [DOI] [PubMed] [Google Scholar]
- 17.Ro H, Min SI, Yang J, et al. Impact of tacrolimus intraindividual variability and CYP3A5 genetic polymorphism on acute rejection in kidney transplantation. Ther Drug Monit. 2012;34:680–685.. [DOI] [PubMed] [Google Scholar]
- 18.Rodrigo E, Segundo DS, Fernández-Fresnedo G, et al. Within-patient variability in tacrolimus blood levels predicts kidney graft loss and donor-specific antibody development. Transplantation. 2016;100:2479–2485.. [DOI] [PubMed] [Google Scholar]
- 19.Shen CL, Yang AH, Lien TJ, et al. Tacrolimus blood level fluctuation predisposes to coexisting BK virus nephropathy and acute allograft rejection. Sci Rep. 2017;7:1986. [DOI] [PMC free article] [PubMed] [Google Scholar]
- 20.Sapir-Pichhadze R, Wang Y, Famure O, et al. Time-dependent variability in tacrolimus trough blood levels is a risk factor for late kidney transplant failure. Kidney Int. 2014;85:1404–1411.. [DOI] [PubMed] [Google Scholar]
- 21.Prytula AA, Bouts AH, Mathot RA, et al. Intra-patient variability in tacrolimus trough concentrations and renal function decline in pediatric renal transplant recipients. Pediatr Transplant. 2012;16:613–618.. [DOI] [PubMed] [Google Scholar]
- 22.Rayar M, Tron C, Jézéquel C, et al. High intrapatient variability of tacrolimus exposure in the early period after liver transplantation is associated with poorer outcomes. Transplantation. 2018;102:e108–e114.. [DOI] [PubMed] [Google Scholar]
- 23.Levey AS, Greene T, Schluchter MD, et al. Glomerular filtration rate measurements in clinical trials. Modification of diet in renal disease study group and the diabetes control and complications trial research group. J Am Soc Nephrol. 1993;4:1159–1171.. [DOI] [PMC free article] [PubMed] [Google Scholar]
- 24.Min SI, Ha J, Kang HG, et al. Conversion of twice-daily tacrolimus to once-daily tacrolimus formulation in stable pediatric kidney transplant recipients: pharmacokinetics and efficacy. Am J Transplant. 2013;13:2191–2197.. [DOI] [PubMed] [Google Scholar]
- 25.Solez K, Colvin RB, Racusen LC, et al. Banff 07 classification of renal allograft pathology: updates and future directions. Am J Transplant. 2008;8:753–760.. [DOI] [PubMed] [Google Scholar]
- 26.Whalen HR, Glen JA, Harkins V, et al. High intrapatient tacrolimus variability is associated with worse outcomes in renal transplantation using a low-dose tacrolimus immunosuppressive regime. Transplantation. 2017;101:430–436.. [DOI] [PubMed] [Google Scholar]
- 27.Bekersky I, Dressler D, Mekki QA. Effect of low- and high-fat meals on tacrolimus absorption following 5 mg single oral doses to healthy human subjects. J Clin Pharmacol. 2001;41:176–182.. [DOI] [PubMed] [Google Scholar]
- 28.Bekersky I, Dressler D, Mekki Q. Effect of time of meal consumption on bioavailability of a single oral 5 mg tacrolimus dose. J Clin Pharmacol. 2001;41:289–297.. [DOI] [PubMed] [Google Scholar]
- 29.Feng HP, Caro L, Fandozzi CM, et al. Pharmacokinetic interactions between elbasvir/grazoprevir and immunosuppressant drugs in healthy volunteers. J Clin Pharmacol. 2018;58:666–673.. [DOI] [PubMed] [Google Scholar]
- 30.Ghadimi M, Dashti-Khavidaki S, Shahali M, et al. Tacrolimus interaction with oral oestrogen in kidney transplant recipients: a case-control study. J Clin Pharm Ther. 2018;43:513–518.. [DOI] [PubMed] [Google Scholar]
- 31.Zhang H, Bu F, Li L, et al. Prediction of drug-drug interaction between tacrolimus and principal ingredients of wuzhi capsule in Chinese healthy volunteers using physiologically-based pharmacokinetic modelling. Basic Clin Pharmacol Toxicol. 2018;122:331–340.. [DOI] [PubMed] [Google Scholar]
- 32.Neuberger JM, Bechstein WO, Kuypers DR, et al. Practical recommendations for long-term management of modifiable risks in kidney and liver transplant recipients: a guidance report and clinical checklist by the consensus on managing modifiable risk in transplantation (COMMIT) group. Transplantation. 2017;1014S Suppl 2S1–S56.. [DOI] [PubMed] [Google Scholar]
- 33.Kahan BD, Welsh M, Urbauer DL, et al. Low intraindividual variability of cyclosporin A exposure reduces chronic rejection incidence and health care costs. J Am Soc Nephrol. 2000;11:1122–1131.. [DOI] [PubMed] [Google Scholar]
- 34.Waiser J, Slowinski T, Brinker-Paschke A, et al. Impact of the variability of cyclosporin A trough levels on long-term renal allograft function. Nephrol Dial Transplant. 2002;17:1310–1317.. [DOI] [PubMed] [Google Scholar]
- 35.Vanhove T, Vermeulen T, Annaert P, et al. High intrapatient variability of tacrolimus concentrations predicts accelerated progression of chronic histologic lesions in renal recipients. Am J Transplant. 2016;16:2954–2963.. [DOI] [PubMed] [Google Scholar]
- 36.Nankivell BJ, Borrows RJ, Fung CL, et al. The natural history of chronic allograft nephropathy. N Engl J Med. 2003;349:2326–2333.. [DOI] [PubMed] [Google Scholar]
- 37.Cosio FG, Grande JP, Larson TS, et al. Kidney allograft fibrosis and atrophy early after living donor transplantation. Am J Transplant. 2005;5:1130–1136.. [DOI] [PubMed] [Google Scholar]
- 38.Naesens M, Kuypers DR, De Vusser K, et al. Chronic histological damage in early indication biopsies is an independent risk factor for late renal allograft failure. Am J Transplant. 2013;13:86–99.. [DOI] [PubMed] [Google Scholar]
- 39.Shuker N, Shuker L, van Rosmalen J, et al. A high intrapatient variability in tacrolimus exposure is associated with poor long-term outcome of kidney transplantation. Transpl Int. 2016;29:1158–1167.. [DOI] [PubMed] [Google Scholar]
- 40.Min SI, Kim SY, Ahn SH, et al. Optimized tacrolimus therapy in the early stage after renal transplantation. J Korean Surg Soc. 2010;79:428–435.. [Google Scholar]
- 41.Rozen-Zvi B, Schneider S, Lichtenberg S, et al. Association of the combination of time-weighted variability of tacrolimus blood level and exposure to low drug levels with graft survival after kidney transplantation. Nephrol Dial Transplant. 2017;32:393–399.. [DOI] [PubMed] [Google Scholar]
- 42.Taber DJ, Su Z, Fleming JN, et al. Tacrolimus trough concentration variability and disparities in African American kidney transplantation. Transplantation. 2017;101:2931–2938.. [DOI] [PMC free article] [PubMed] [Google Scholar]
- 43.Andrews LM, De Winter BC, Van Gelder T, et al. Consideration of the ethnic prevalence of genotypes in the clinical use of tacrolimus. Pharmacogenomics. 2016;17:1737–1740.. [DOI] [PubMed] [Google Scholar]
- 44.Stifft F, Stolk LM, Undre N, et al. Lower variability in 24-hour exposure during once-daily compared to twice-daily tacrolimus formulation in kidney transplantation. Transplantation. 2014;97:775–780.. [DOI] [PubMed] [Google Scholar]
- 45.Shuker N, Cadogan M, van Gelder T, et al. Conversion from twice-daily to once-daily tacrolimus does not reduce intrapatient variability in tacrolimus exposure. Ther Drug Monit. 2015;37:262–269.. [DOI] [PubMed] [Google Scholar]


