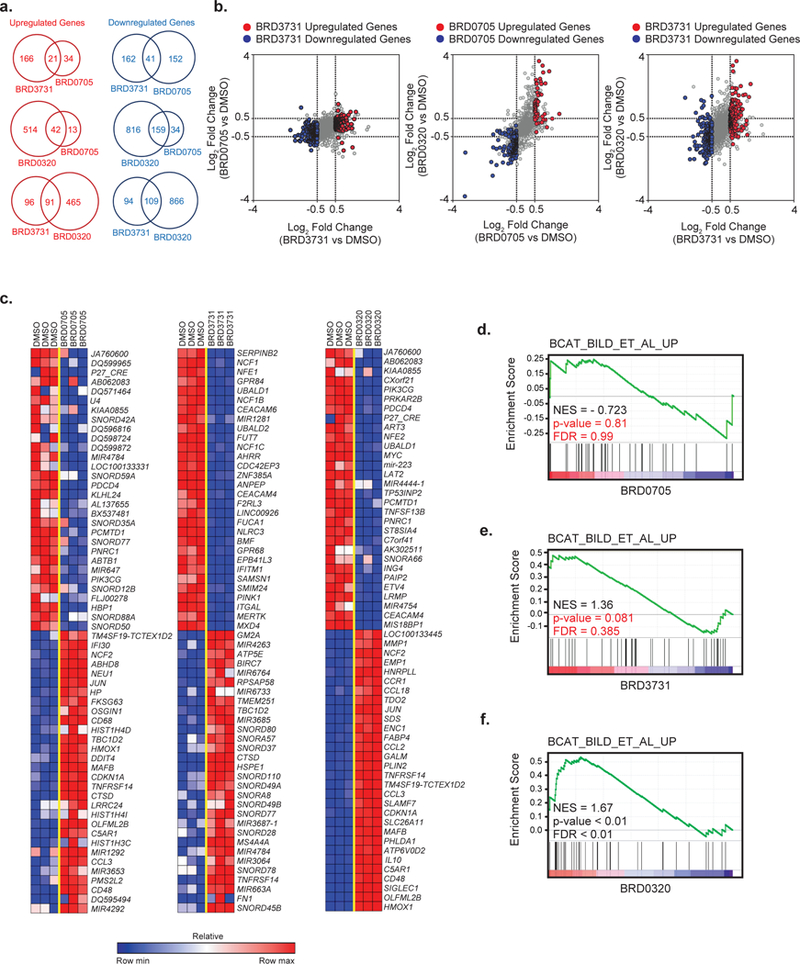
Figure 6: GSK3α and GSK3β selective inhibitors trigger differential transcriptional programs.

(a) Venn diagrams and (b) scatterplots of hits modulated after BRD0705, BRD3731 or BRD0320 treatment. Significantly depleted or enriched genes after BRD3731 or BRD0705 treatment are highlighted respectively in blue and red (Log2FC < −0.5 or > 0.5 and p-value ≤ 0.05). (c) Heatmaps of the top 30 genes differentially expressed by genomic profiling upon BRD0705, BRD3731 or BRD0320 treatment in the U937 cell line. Depleted and enriched genes are respectively in blue and red. Data is presented as row normalized. The BRD0705, BRD3731 and BRD0320 signatures identified by RNAseq were then interrogated in a functional enrichment analysis across the MsigDB database. GSEA plots for β-catenin signaling pathway induction after treatment with BRD0705 (d), BRD3731 (e) or BRD0320 (f).
