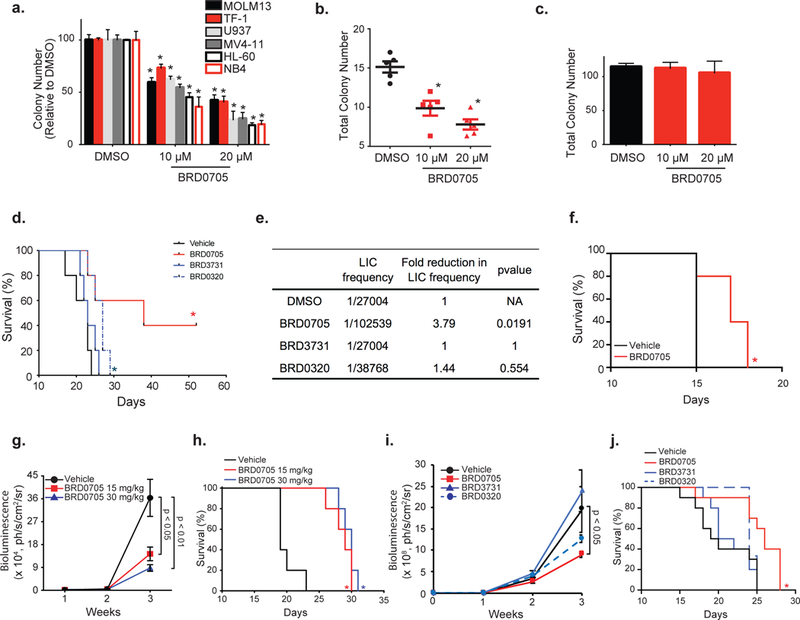
Figure 7: BRD0705 impairs colony formation in AML cell lines and patient cells and shows in vivo efficacy in multiple AML mice models.

Colony formation assay of the indicated AML cell lines (a), 5 primary AML samples (b) and human CD34 cells (c) after BRD0705 treatment. Data represented as mean ± SEM of three replicates. (d) MLL-AF9 cells injected into secondary recipient mice after pretreatment with DMSO, BRD0705, BRD3731 or BRD0320 in a serially diluted manner. .Kaplan-Meier curves for the 250 000 cells dilution (n=5 per group). (e) Frequency of Leukemia Initiating Cells (LIC) calculated using ELDA software. (f) MLL-AF9 AML cells injected into secondary recipient mice before treatment with vehicle (black) or BRD0705 at 30 mg/kg (red). Kaplan-Meier curves for each group of mice (n=5 per group). (g) HL-60-Luc cells injected into recipient mice and treated with vehicle (black), BRD0705 at 15 mg/kg (red) or 30 mg/kg (blue). Bioluminescence was quantified. (h) Kaplan-Meier curves for each group of mice (n=5 per group). (i) MV4–11-Luc cells injected into recipient mice and treated with vehicle (black), BRD0705 (red), BRD3731 (blue) or BRD0320 (dashed blue). Bioluminescence was quantified. Data represented as mean ± SEM. P-value calculated on the latest time point. (j) Kaplan-Meier curves for each group of mice (n=10 per group). * p-value < 0.05 determined by log-rank (Mantel-Cox) test in comparison with vehicle.
