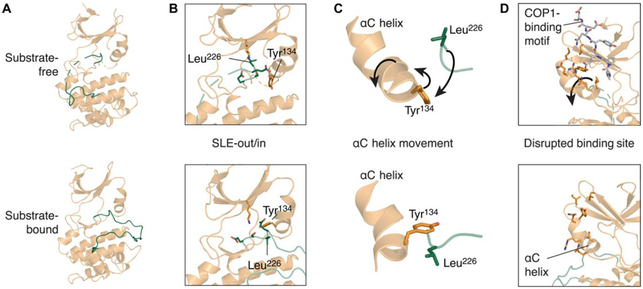
Fig. 3. TRIB1 conformational changes upon substrate binding.
(A to D) Comparison of structures of substrate-free (top; PDB ID 5CEM) and C/EBPα-bound TRIB1 (bottom; this work). (A) Overview from the substrate-binding side of the molecule. (B) SLE motif and surrounding residues within the active site from the same orientation as (A). (C) Simplified view showing the relative organization of the αC helix, Tyr134, and Leu226 from the opposite orientation to (A) and (B). (D) Position of the αC helix and residues that contact the C-terminal tail of TRIB1 in substrate-free TRIB1; orientation as described in (C). Movement of selected features upon C/EBPα binding are indicated with arrows (top), and residues are selectively depicted as sticks for clarity.

