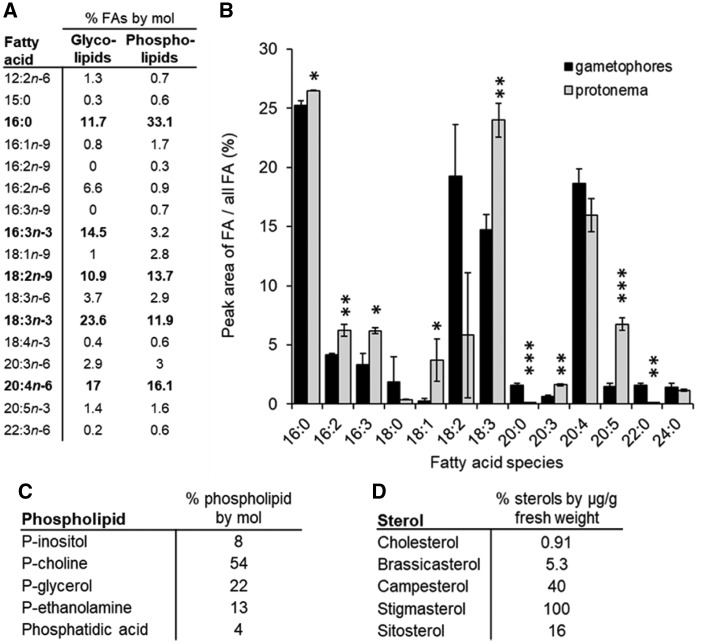
Fig. 2.
Composition of various groups of membrane lipids and tissue types in P. patens. (A) FA composition in glycolipids and phospholipids of P. patens (Grimsley 1981). Bold letters mark major FA with >10% relative abundance. (B) FA profile in different tissue types of P. patens (Beike et al. 2014). Asterisks represent results of a student t-test (*P < 0.05, **P < 0.01, ***P < 0.001). (C) Distribution of head groups in phospholipids of P. patens (Grimsley 1981). (D) Distribution of steroid core structures in P. patens (Morikawa et al. 2009).

