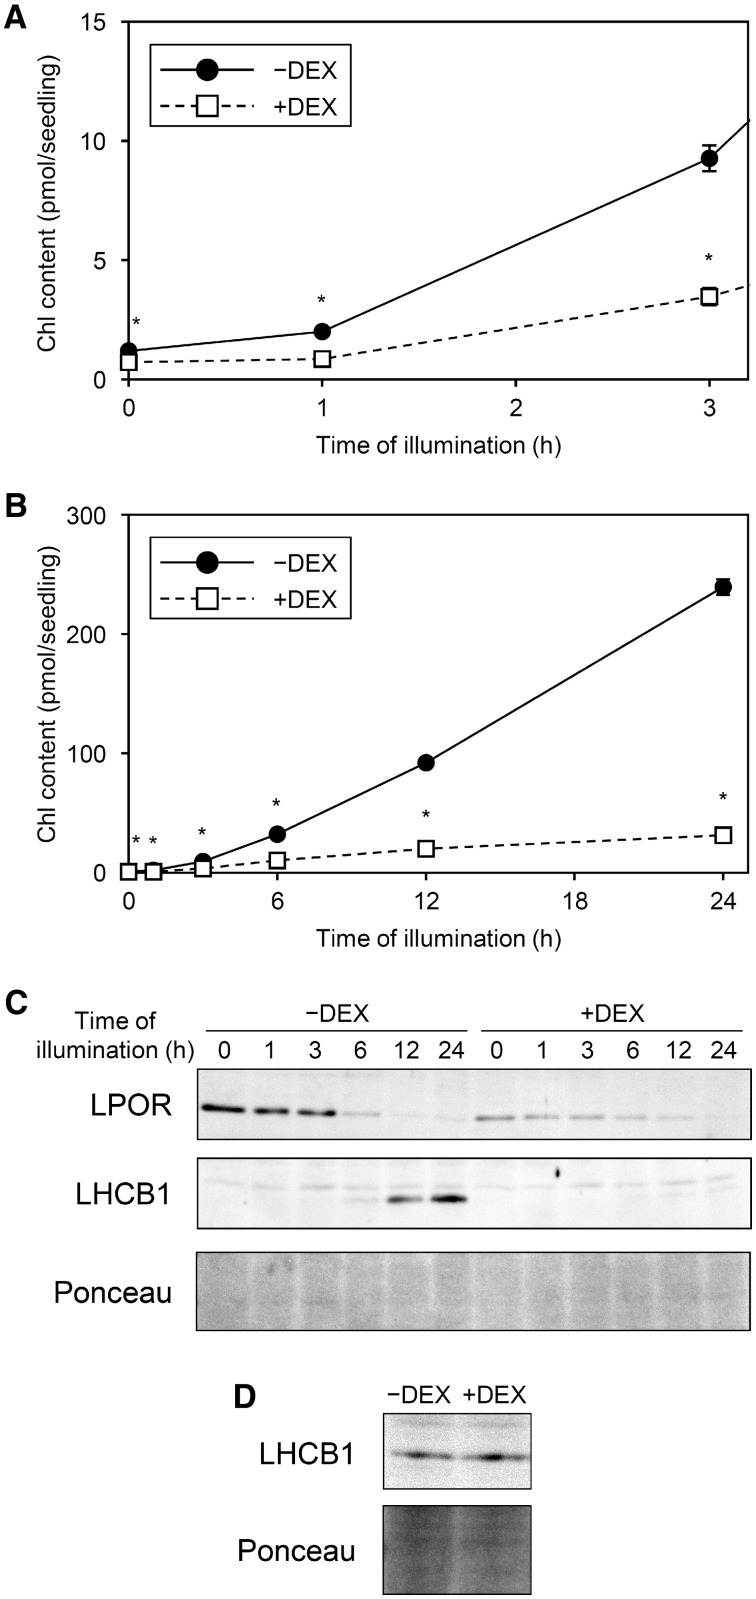
Fig. 5.
Changes in Chl and protein levels during greening of dark-grown amiR-MGD1 seedlings. Seedlings were illuminated for indicated hours after 4-d growth in the dark in the absence (−) or presence (+) of DEX. (A, B) Chl content per seedling. The amount of protochlorophyllide (Fujii et al. 2017, www.plantphysiol.org. Copyright American Society of Plant Biologists) is shown for 0 h instead of Chl amount. (A) is an enlarged view of (B) within 3 h of illumination. Data are mean � SE from 12 (0, 1, 3, 6, 12 h) or 6 (24 h) independent experiments. Asterisks indicate significant difference from −DEX control (P < 0.05, Student’s t-test). (C) Time course immunoblot analysis of LPOR and LHCB1 proteins and (D) detection of LHCB1 proteins in seedlings illuminated for 3 h. In (D), 50 μg of total protein was used to detect faint LHCB1 signals from 3-h illuminated samples, whereas 10 μg of total protein was used for the time course analysis in (C). Unspecific bands were constantly observed above the LHCB1 bands. Data are representative of three independent experiments. Ponceau-stained proteins were shown as a loading control.

