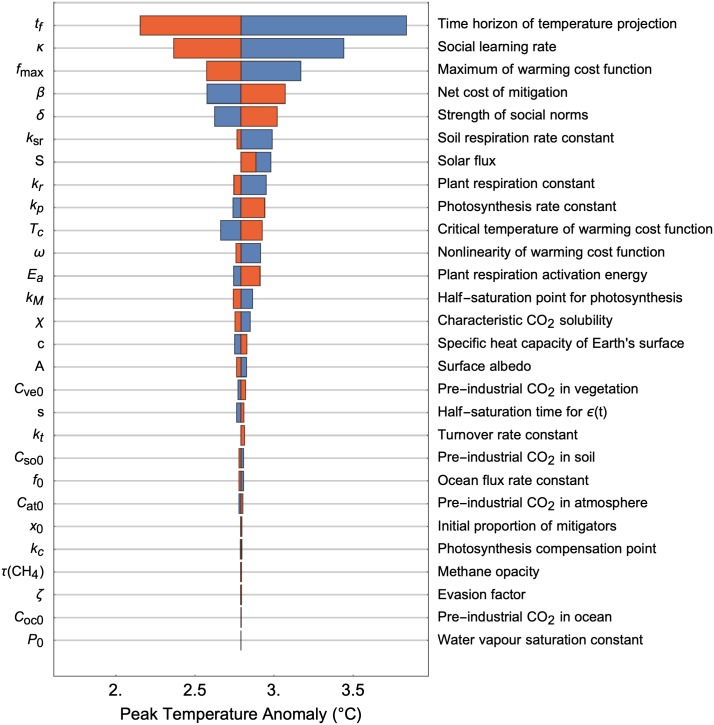
Fig 4. Peak temperature anomaly is sensitive to both social and climate parameters.
Tornado plot showing the deviation in peak temperature anomaly when parameters are varied individually. A red (blue) bar indicates the deviation when the specified parameter adopts its upper (lower) bound, while all other parameters are fixed at baseline values (S2 Table). Parameters ordered by relative impact from top to bottom. Additional details in Methods.

