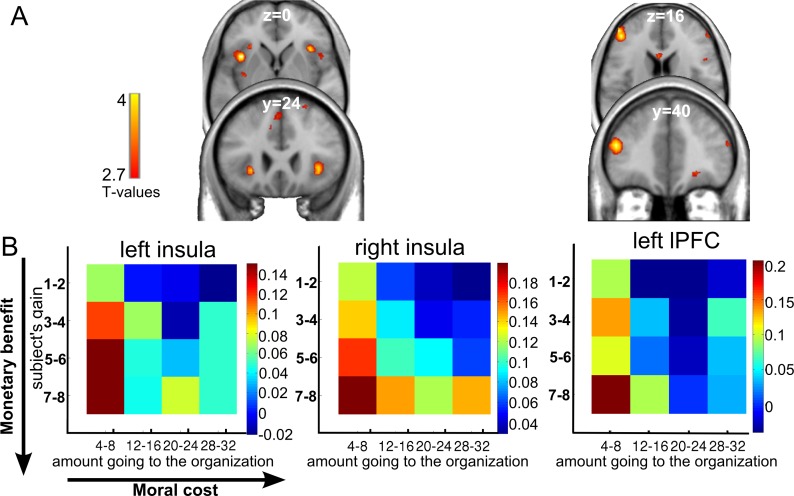
Fig 3. In the NEG ORG context, bilateral insula and lateral PFC activity correlated with DV at the time of decision-making.
A. BOLD response in the bilateral insula and lateral PFC was positively correlated with the DV in the NEG ORG. B. Heatmaps were created by averaging parameter estimates versus baseline within anterior insula and lateral PFC clusters for each cell of a 4 × 4 monetary benefit versus moral cost matrix (resulting from collapsing the original 8 × 8 matrix, see Methods). Color coding reflects the strength of the neural response, with dark red representing the strongest activation and dark blue representing the lowest activation. See S1 Data. fMRI data corresponding to this figure can be found at the following URL: https://neurovault.org/collections/5028/. BOLD, blood-oxygenation-level–dependent; DV, decision value; fMRI, functional MRI; lPFC, lateral PFC; NEG ORG, negatively valued organization; PFC, prefrontal cortex.

