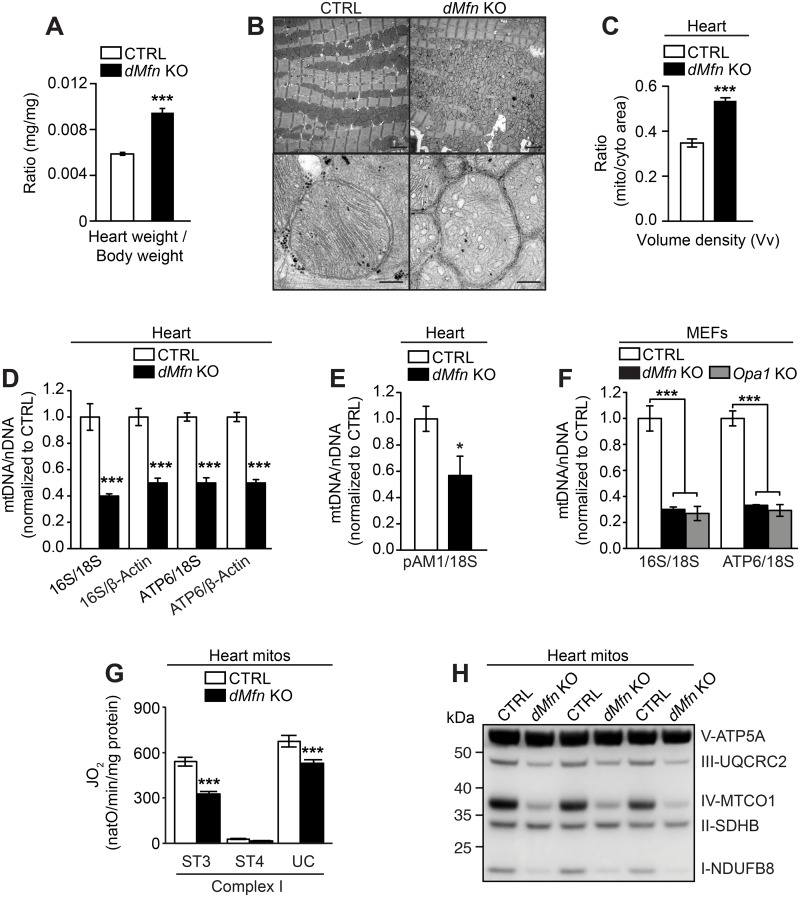
Fig 1. Loss of outer membrane fusion results in mtDNA depletion and OXPHOS dysfunction.
(A) Heart weight to body weight ratio of male and female control (n = 19) and dMfn KO (n = 13) mice at 5 weeks of age. (B) Representative images of fixed heart tissue from control and dMfn KO animals at 5 weeks of age analyzed by electron microscopy. For each genotype 3–5 biological replicates were analyzed. Scale bars represent 2 μm for overview image and 0.2 μm for zoom-in image. (C) Volume density (Vv) analysis in heart of control (n = 5) and dMfn KO (n = 3) animals at 5 weeks of age as determined by ratio of mitochondria to cytoplasmic area from electron microscopy images. (D) Quantitative PCR analysis of mtDNA copy number (16S and ATP6) normalized to nuclear DNA (β-Actin and 18S) from heart samples of control (white bar) and dMfn KO (black bar) at 5 weeks of age (n = 5 of for each genotype). (E) Quantification of mtDNA levels by Southern blot analyses of control and dMfn heart KO samples (n = 3 for each genotype) at 5 weeks. The mtDNA levels (pAM1) were normalized to nuclear DNA (18S). (F) Quantitative PCR analysis of mtDNA copy number (16S and ATP6) normalized to nuclear DNA (β-Actin and 18S) from control (white bars), dMfn KO (black bars), Opa1 KO (gray bars) MEFs (n = 4 of each genotype). (G) Oxygen consumption rates of heart mitochondria isolated from control and dMfn KO animals at 5 weeks of age, n = 10 for both genotypes. Mitochondrial respiration was assessed under phosphorylating (ST3), non-phosphorylating (ST4), and uncoupled (UC) conditions using complex I substrates. (H) Western blot of OXPHOS proteins from heart mitochondria from control and dMfn KO animals at 5 weeks of age (n = 3 for each genotype). Error bars indicate ± SEM. For (A, C, and G), Student T-test; *, P < 0.05; ***, P < 0.001. For (F), one-way ANOVA using Turkey’s multiple comparison test; ***, P < 0.001.

