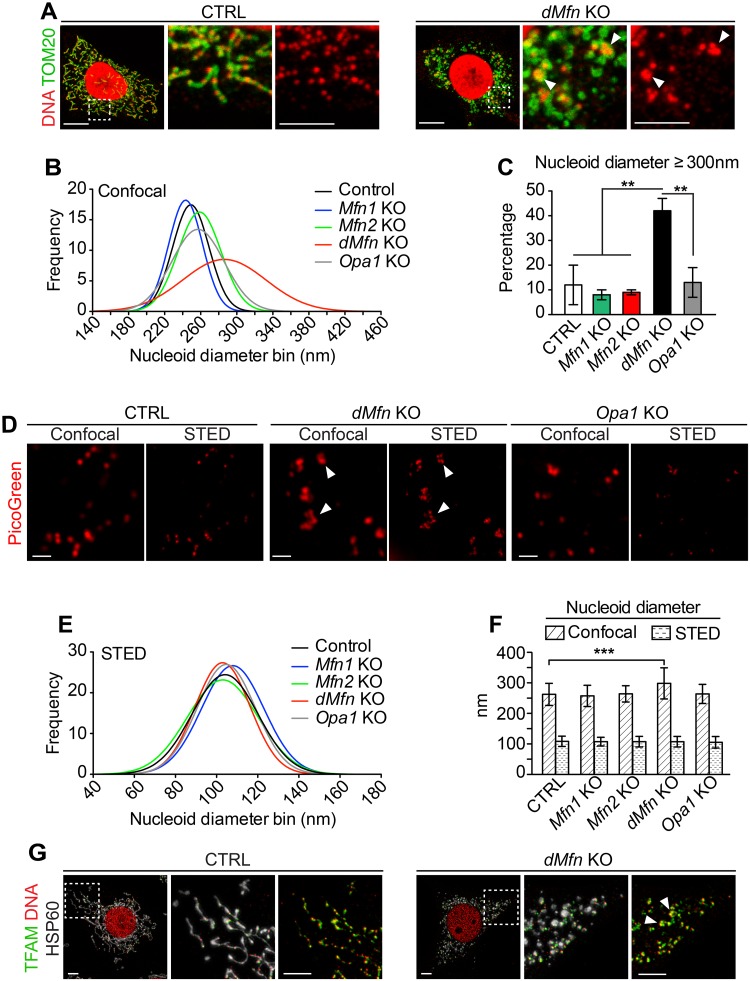
Fig 3. Loss of outer membrane fusion results in mitochondrial nucleoid clustering.
(A) Confocal microscopy images of control and dMfn KO MEFs immunostained to detect TOM20 protein or DNA. Dashed boxes specify the areas of magnification shown in the panels to the right. Scale bars, main image 10 μm, zoom-in 5 μm. Three independent experiments were performed per genotype. (B) Gaussian distribution of diameters of PicoGreen-labeled nucleoids as determined by confocal microscopy of control, Mfn1 KO, Mfn2 KO, dMfn KO, and Opa1 KO MEFs. (C) Quantification of PicoGreen-labeled nucleoids with a diameter ≥ 300 nm as determined by confocal microscopy. For each cell type (n = 3–6) up to 35 nucleoids were analyzed per cell. (D) Images of PicoGreen-labeled nucleoids from control, dMfn KO, Opa1 KO MEFs. Scale bar 500 nm. (E) Gaussian distribution diameters of PicoGreen-labeled nucleoids from STED-acquired images in control, Mfn1 KO, Mfn2 KO, dMfn KO, Opa1 KO MEFs. (F) Average diameters of PicoGreen-labeled nucleoids in control, Mfn1 KO, Mfn2 KO and dMfn KO MEFs from confocal and STED-acquired images. The nucleoid diameters were measured at full width at half maximum on 100 nucleoids from each genotype. Error bars indicate standard deviation of the mean. For each genotype, nucleoid diameters were determined from n = 3–6 cells. (G) Representative images from 3 independent experiments of control and dMfn KO MEFs stained with anti-TFAM, anti-DNA and anti-HSP60 antibodies. Scale bar is 5 μm. Error bars indicate ± SEM. For (C and F), one-way ANOVA using Turkey’s multiple comparison test; **, P < 0.01; ***, P < 0.001. Arrows indicate clustered mtDNA.

