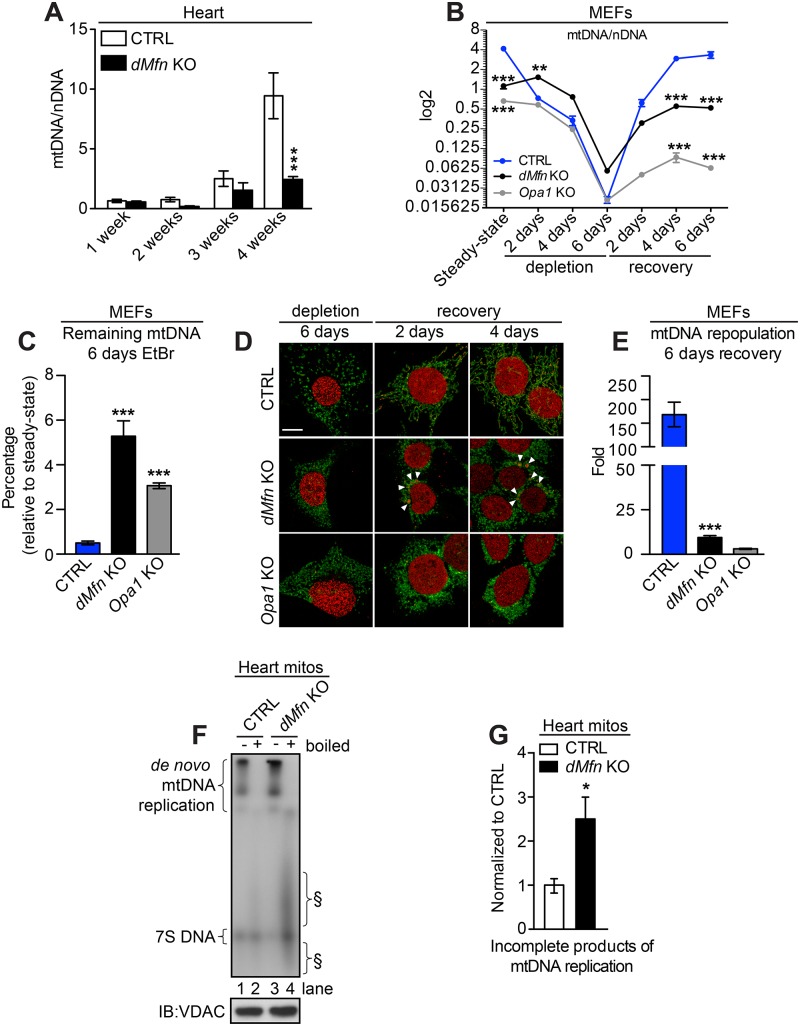
Fig 7. Loss of mitochondrial fusion impairs mtDNA replication.
(A) Quantitative PCR analysis of mtDNA copy number (ATP6) normalized to nuclear DNA (18S) in heart samples from control and dMfn KO between 1–4 weeks of age (n = 3–10 per genotype). (B) Quantitative PCR analysis of mtDNA copy number (ATP6) normalized to nuclear DNA (18S) from control, dMfn KO, and Opa1 KO MEFs after treatment with 100 ng/ml ethidium bromide (EtBr), n = 4–8 replicates per genotype. (C) Quantification of mtDNA levels in control, dMfn KO, and Opa1 KO MEFs after 6 days of treatment with 100 ng/ml EtBr, n = 4 for all genotypes. (D) Representative confocal images of control, dMfn KO, and Opa1 KO MEFs during and after EtBr treatment. Cells were immunostained with anti-dsDNA and anti-TOM20 antibodies, n = 3 for each genotype. Scale bars represent 10 μm. White arrows point to clustered nucleoids. (E) Quantification of the fold change of mtDNA after 6 days of recovery from treatment with 100 ng/ml EtBr in control, dMfn KO, and Opa1 KO MEFs (n = 4 for all genotypes). (F) Mitochondrial de novo replication assay in heart mitochondria from control (n = 12) and dMfn KO (n = 8) animals at 3–4 weeks of age, normalized to VDAC protein levels (bottom panel). Incomplete mtDNA replication products (§) are indicated. Numbers mark the different mtDNA lanes (G) Quantification of the abundance of incomplete mtDNA replication products produced de novo in control (n = 6) and dMfn KO (n = 7) heart mitochondria at 3–4 weeks of age. For all, error bars indicate ± SEM. (A) and (B), two-way ANOVA using Bonferroni multiple comparison test; **, P < 0.01; ***, P < 0.001. (C) and (D), one-way ANOVA using Turkey’s multiple comparison test; ***, P < 0.001. (G) Student T-test; *, P < 0.05.

