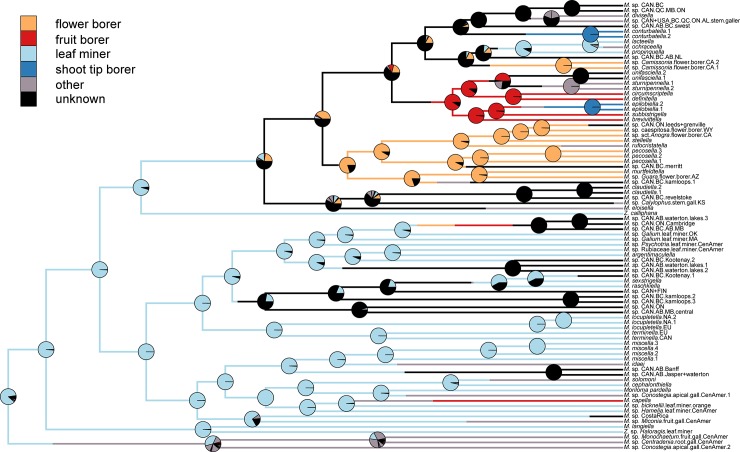
Fig 5. Ancestral trait reconstruction for momphid hostplant resource.
Stochastic character mapping with 10,000 replicates. Posterior probabilities of ancestral states at each node are displayed as pie charts. Branches and pie charts are colored coded to the most likely character state at each node. Because of the many character states (15) found in the hostplant resource, we colored the most prevalent states and placed the remaining states in the “other” category.

