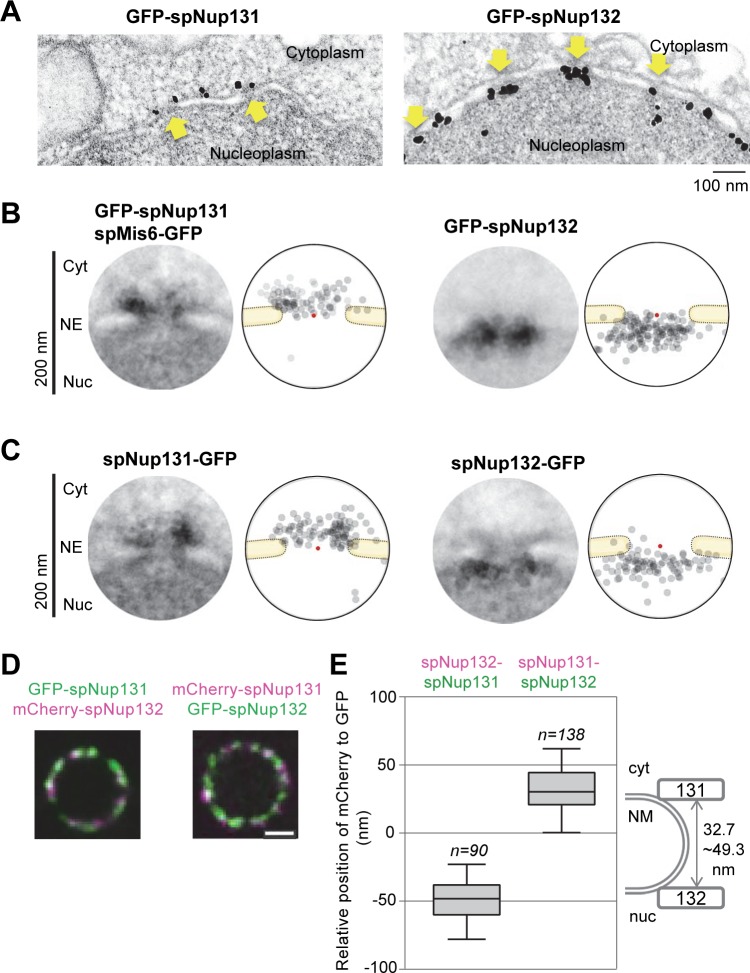
Fig 1. Localization of spNup131 and spNup132 at the NPC.
(A) IEM of GFP-spNup131 and GFP-spNup132. Arrows indicate the nuclear pores. Scale bar, 100 nm. (B) Quantitative representation of IEM for N-terminally tagged spNup131 and spNup132. (left) A montage image of 20 immunoelectron micrographs. The diameter of the circle is 200 nm. (right) A schematic drawing illustrating the distribution of immunogold particles shown in the montage image. Red dots represent the pore centers. (C) Quantitative representation of IEM for C-terminally tagged spNup131 and spNup132. Montage pictures and distributions of immunogold particles are shown as described in (B). IEM micrographs used for the quantitative analysis are available in S1 Dataset. (D) Fluorescence microscopy of a nucleus simultaneously expressing spNup131 and spNup132 fused to GFP and mCherry in living cells. Single section images of the same focal plane are shown. (left) A nucleus expressing GFP-spNup131 and mCherry-spNup132. Green, GFP-spNup131; Magenta, mCherry-spNup132. (right) A nucleus expressing mCherry-spNup131 and GFP-spNup132. Magenta, mCherry-spNup132; Green, GFP-spNup131. Scale bar, 1 μm. (E) Distances between spNup131 and spNup132 in living cells. Results from cells expressing GFP-spNup131 and mCherry-spNup132 (n = 90, left) and results from cells expressing mCherry-spNup131 and GFP-spNup132 (n = 138, right) are shown in the box plot: values of the distance determined in individual cells are shown in S2 Dataset. Center lines show the medians; box limits indicate the 25th and 75th percentiles. Whiskers extend to the 5th and 95th percentiles. The diagram on the right shows the positions of spNup131 and spNup132 within the NPC.

