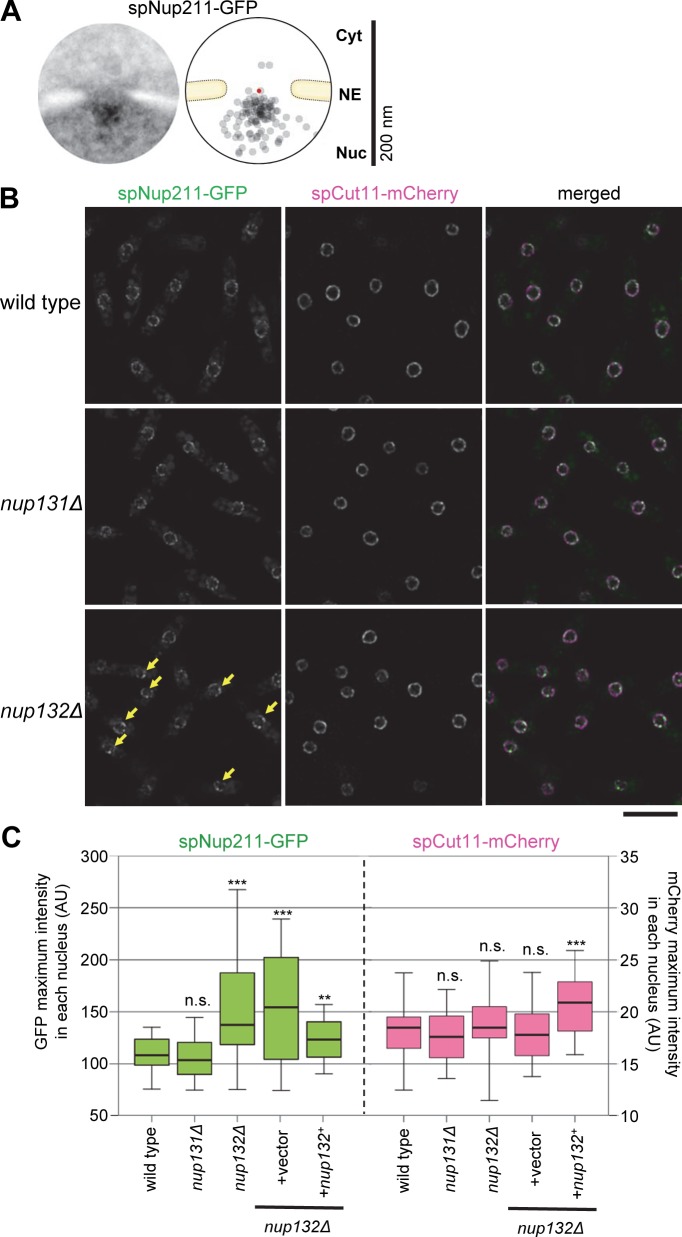
Fig 3. spNup132 is required for the distribution of the nucleoplasmic nucleoporin spNup211 at the NPC.
(A) IEM of spNup211-GFP. For quantitative representation, a schematic drawing illustrating the distribution of immunogold particles based on 20 immunoelectron micrographs is shown. The red point indicates the pore center. Individual IEM micrographs and the projection image are available in S4 Dataset. (B) FM of spNup211-GFP in living cells growing exponentially. Single section images of the same focal plane are shown. Arrows indicate bright dots observed in nup132Δ cells. Scale bar, 10 μm. (C) Maximum intensity values of spNup211-GFP and spCut11-mCherry in wild type (n = 76), nup131Δ (n = 50), nup132Δ (n = 73), nup132Δ +vector (n = 61) and nup132Δ +nup132+ (n = 46) cells: values of the maximum intensity determined in individual cells are shown in S5 Dataset. In the box plot, the center lines show the medians; box limits indicate the 25th and 75th percentiles. Whiskers extend to the 5th and 95th percentiles. Averages (± standard deviations) are 110.1 ± 22.7, 105.0 ± 21.5, 154.7 ± 64.1, 153.2 ± 56.5 and 121.9 ± 23.9 for spNup211-GFP, and 18.0 ± 3.2, 17.6 ± 3.0, 18.8 ± 4.0, 18.2 ± 3.1 and 20.8 ± 3.3 for spCut11-mCherry in wild type, nup131Δ, nup132Δ, nup132Δ+vector and nup132Δ+nup132+, respectively. Asterisks represent the p value of Mann-Whitney’s U-test, when compared with wild type: **, p<0.01; ***, p<0.001. n.s., no significant difference (p>0.05).

