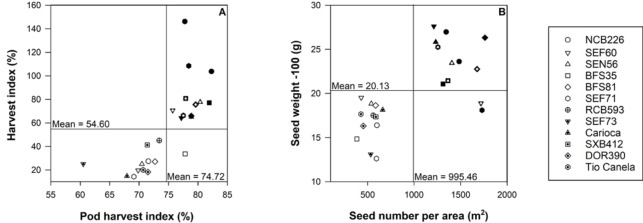
Fig 2.
Harvest index (%) and pod harvest index (%) (panel A); seed weight -100 (g) and seed number per area (m2) (panel B) for 12 common bean genotypes (abbreviations centered over data points) grown in the field at CIAT under irrigated (blue) or rainfed (drought) (maroon) conditions. Standard errors have been removed for clarity (where n = 3).

