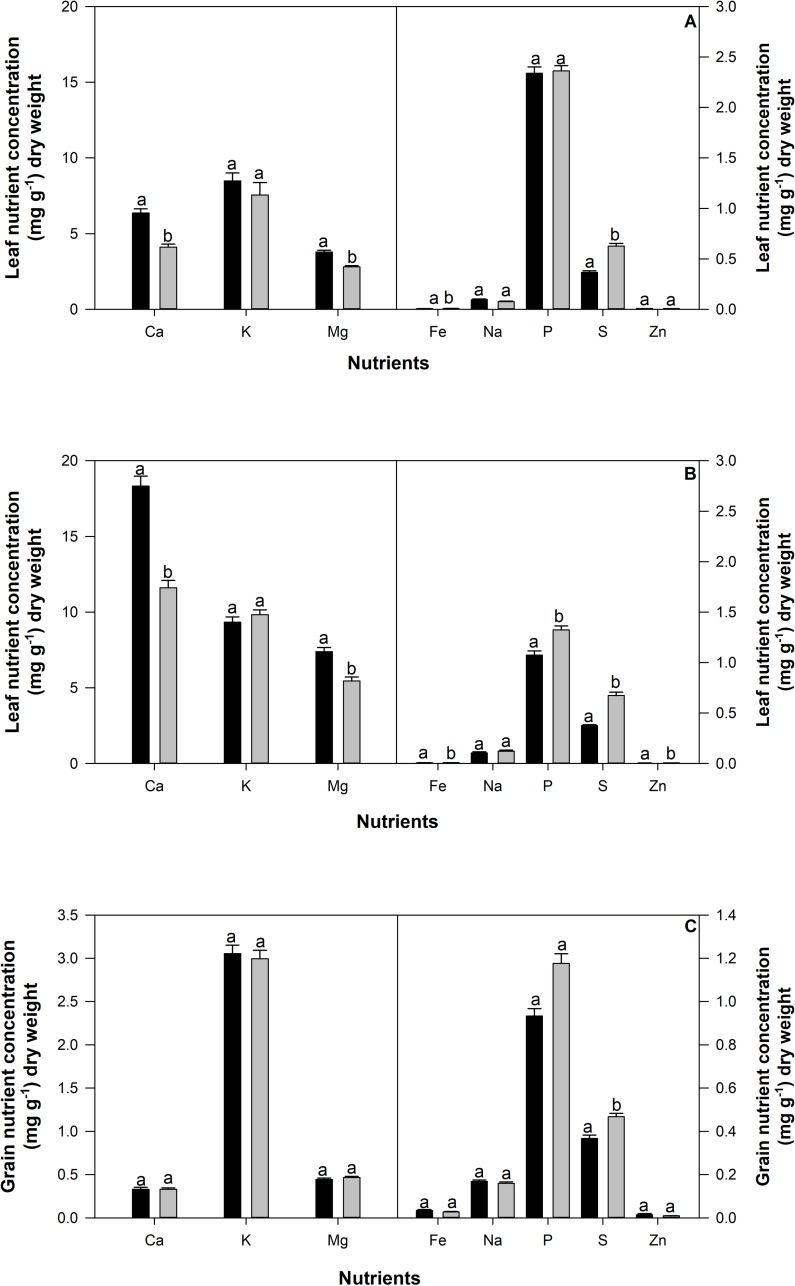
Fig 4.
Concentration of nutrients found in the soluble leaf (mg g-1) at flowering (panel A) and pod maturity (panel B) and digest seed (panel C) (mg g-1) in 12 common bean genotypes grown in the field at CIAT under irrigated (black bars) or rainfed (drought) (grey bars) conditions during flowering (top panel) and pod set (middle panel) and harvest (bottom panel). Letters denote significance between treatments. Statistically significant differences were observed between development stages for soluble leaf nutrients (multiple comparisons are not shown). Standard errors are shown where; n = 36.

