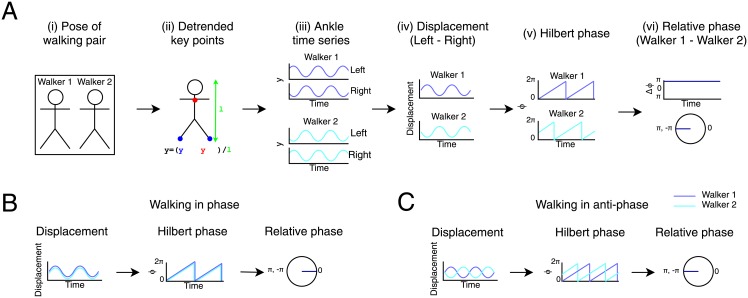
Fig 2. Analysis of relative phase illustrated.
(A) Main stages of data analysis performed on pose estimates from videos of walking pairs. (i) We tracked the pose of Walker 1 and Walker 2 from each video clip. For details, see Fig 1A. (ii) We detrended key point coordinates for each walker within frames by subtracting a reference point on the same skeleton (yref, the neck) from the ankle coordinates (ya) and dividing by the length of the skeleton (l). (iii) This resulted in a time-series of y-coordinates for the left and right ankles for Walker 1 and Walker 2. (iv) For each walker, we subtracted right from left ankle coordinates to give a time series of the left-right displacement between ankles. (v) We used the Hilbert phase of the displacement signal to approximate walking angle for each walker. (vi) Finally, we computed the difference between the phase of Walker 1 and Walker 2 to obtain a time series of the relative phase of the walkers (upper panel) from which we computed the distribution of relative phase on the circular axis (lower panel). For a similar analysis, see [17] (B) Pair walking in phase. The ankle displacement signal overlaps for Walker 1 and Walker 2, as the pair walks perfectly in phase. There is therefore a constant relative phase of 0. (C) Pair walking in anti-phase. The displacement signals are in antiphase with each other. There is a constant absolute phase difference of π between the signals in the Hilbert phase time series, leading to a relative phase distribution with a peak at π.

