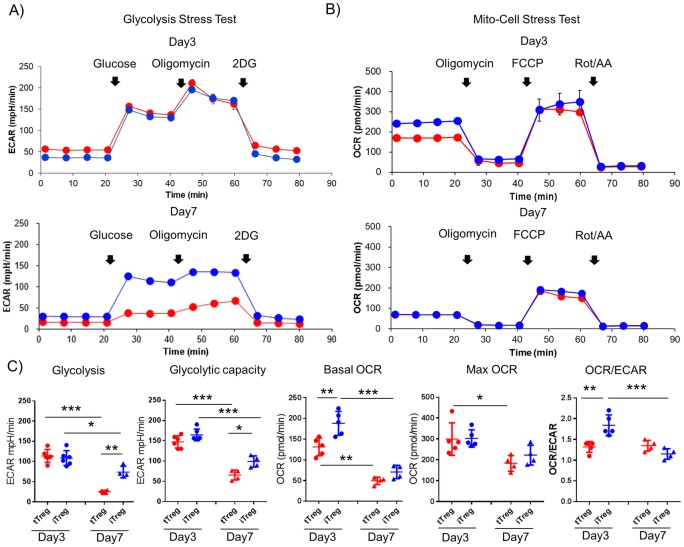
Fig 2. Metabolic traits of in vitro activated human tTregs and iTregs.
Real-time measurements of (A) extra cellular acidification rates (ECAR) and (B) oxygen consumption rates (OCR) of activated tTregs (red) and iTregs (blue) were assessed in response to glucose, oligomycin, and 2-deoxy-D-glucose (2DG) (glycolysis stress test, A) and oligomycin, carbonyl cyanide-p-trifluoromethoxyphenylhydrazone (FCCP) and rotenone/ antimycin (mito-cell stress test, B) at day 3 and 7 post activation, respectively. Representative real-time data are shown from 5 individuals for day 3 and 4 individuals for day 7 (mean ±s.d. of n = 3 samples per group). (C) Metabolic profiling data of day3 (left side) and day 7 (right side). Glycolysis and glycolytic capacity from glycolysis stress test and basal OCR, MAX OCR and OCR/ECAR ratio from mito-cell stress test, are plotted with mean line and s.d. bar, respectively. Statistical analysis shown only on significant different data (*P<0.05, **P<0.01 ***P<0.001, One way ANOVA followed by Tukey’s multiple comparison).

