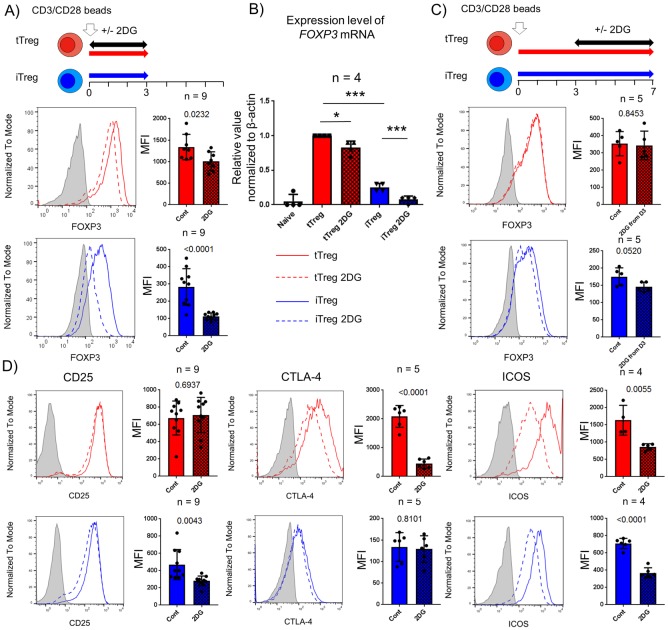
Fig 4. Critical requirement of glucose metabolism in Tregs for optimal expression of functional molecules during initial activation.
0.5mM 2-deoxy-D-glucose (2DG, used to inhibit glycolysis, was added from the onset to day3 (A, B and D), and from 3 to 7 days post activation (C) in tTreg (red) and iTreg (blue). Flow analyses for FOXP3, CD25, CTLA-4 and ICOS were performed gated on live CD4+ cells. Data are shown as non-treated control and 2DG treated as solid and dot lines in representative histograms with isotype control staining (filled gray). Solid (non-treated, Cont) and checked (2DG treated, 2DG) boxes with bar graph indicates the mean fluorescence intensity (MFI) ±s.d.. (B) Quantitative PCR analysis of all FOXP3 mRNA were performed with post sorted naïve T conventional cells (Naïve) and 3 days cultured products (tTreg and iTreg±2DG). Representative data is shown from at least 3 independent experiments. Statistical analyses were performed by Student’s t-test or One way ANOVA following Tukey’s multiple comparison (*P<0.05, *** P<0.001 is shown only on significant different data in multiple comparison).

