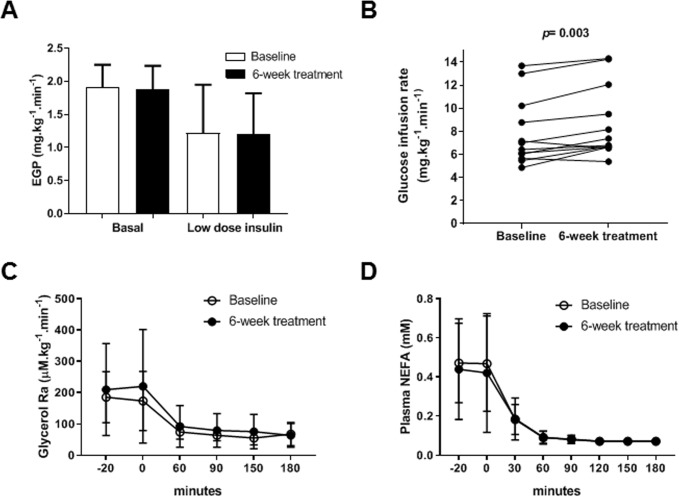
Fig 2. Euglycemic hyperinsulinemic clamp.
(A-B) Glucose metabolism. (C-D) Lipid metabolism. Endogenous glucose production (EGP) at baseline (open bars) and after 6 weeks of antiviral treatment (black bars) in the basal state and during low-dose insulin infusion rate (0.3 mU.kg-1.min-1). Data are means ± SD. (B) Glucose infusion rate during high-dose insulin infusion rate (1 mU.kg-1.min-1) at baseline and after 6 weeks of antiviral treatment (**p = 0.003). Insulin-mediated lipolysis suppression at baseline and 6-week treatment measured by (C) glycerol tracer (n = 8) and by (D) non-esterified fatty acid (NEFA) levels in plasma (n = 12), in basal state and clamp conditions. Data are means ± SD.

