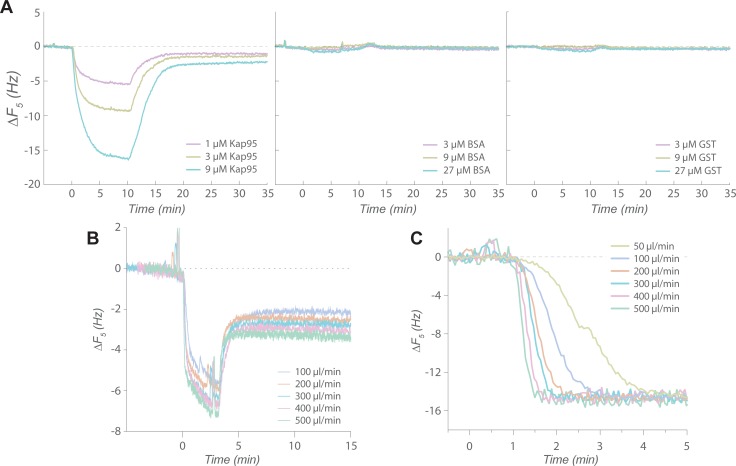
Fig 3. Analyte binding assayed by QCM-D.
(A) Binding of different analytes on an Nsp1FG surface: Kap95 (left), BSA (middle), and GST (right). (B) Dependence of Kap95 binding to Nsp1FG surface on the flow rate. Changes in resonance frequency (ΔF5, 5th overtone) upon Kap95 binding are shown for different flow rates. (C) Sensing volume replacement by glycerol solution at different flow rates (see main text). Changes in resonance frequency (ΔF5, 5th overtone) after introducing feed solution containing glycerol (without any analyte) are shown for different flow rates.

