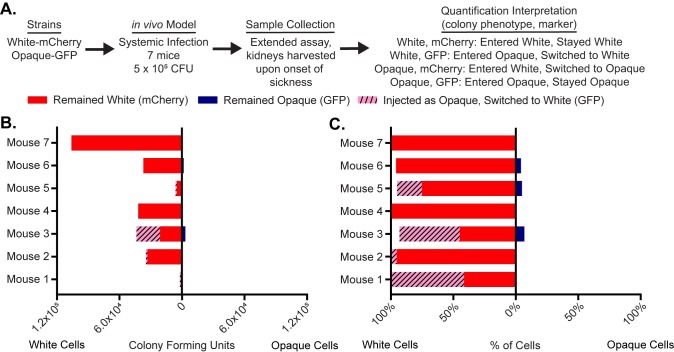
Fig 3. White cells are preferred in the kidney in long-term infections.
(a) Using a flowchart, the experimental setup, cell type, and potential fluorescence phenotypes for each strain are tabulated. In this case, white cells expressing mCherry and opaque cells expressing GFP were co-injected into the tail-veins of 7 mice. Once the mice became ill, the kidney was processed to measure white and opaque cell colonization as well as white-opaque switching. The mechanistic interpretation of each phenotype; in other words, whether or not it indicates cell-type switching, is also indicated. (b) The number of colony-forming units of cells that remained white (i.e. white cells expressing mCherry, red), that remained opaque (i.e. opaque cells expressing GFP, blue), and that switched from opaque-to-white (i.e. white cells expressing GFP, dashed pink) are plotted per mouse as a horizontal bar graph. The left side of the horizontal bar graph refers to cells that were white at the end of the experiment while the right side refers to cells that were opaque at the end of the experiment. (c) The percentage of total cells that remained white (i.e. white cells expressing mCherry, red), that remained opaque (i.e. opaque cells expressing GFP, blue), and that switched from opaque-to-white (i.e. white cells expressing GFP, dashed pink) are plotted for each mouse as a horizontal bar graph. The left side of the horizontal bar graph refers to cells that were white at the end of the experiment while the right side refers to cells that were opaque at the end of the experiment. The raw data for this experiment is available in S5 Data.

