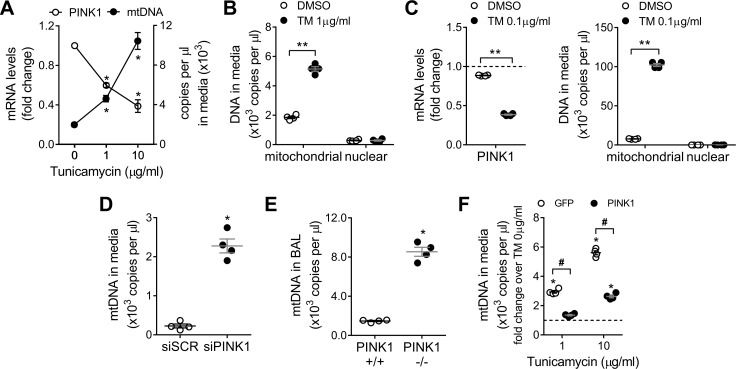
Fig 1. PINK1 deficient lung epithelial cells selectively release mitochondrial DNA.
(A) PINK1 mRNA levels and mtDNA copies in culture media in A549 cells treated with increasing doses of TM for 24h (n = 3; *p<0.01 vs TM 0μg/ml; two-way ANOVA with multiple comparison). (B) Mitochondrial and nuclear DNA copies detected in culture media in A549 cells treated with TM 1μg/ml for 24h (n = 4; **p<0.0001; two-way ANOVA with multiple comparison). (C) PINK1 mRNA levels in primary human alveolar epithelial cells treated 24h with TM 0.1μg/ml (n = 4; **p<0.0001; unpaired t-test). Mitochondrial and nuclear DNA copies detected in culture media in primary human alveolar epithelial cells treated 24h with TM 0.1μg/ml. (n = 4; **p<0.0001; two-way ANOVA with multiple comparison). (D) MtDNA copies in culture media in PINK1 knock-down A549 cells (n = 3, *p<0.001 vs scramble; unpaired t-test). (E) MtDNA copies detected in the BAL fluid of PINK1 +/+ and -/- mice (n = 4, *p<0.001 vs PINK1 +/+; unpaired t-test). (F) MtDNA copies in culture media in A549 cells overexpressing GFP or PINK1 then treated with increasing doses of TM for 24h (n = 4; *p<0.01 vs TM 0μg/ml, #p<0.001 vs GFP; two-way ANOVA with multiple comparison). Dot plots represent mean ± SEM. See S1 Fig for details about ER stress markers levels after TM treatment and knock-down / overexpression efficiencies.

