
Fig 4. Phenetic sub-network inference analysis of differential protein expression in STM versus SENT.
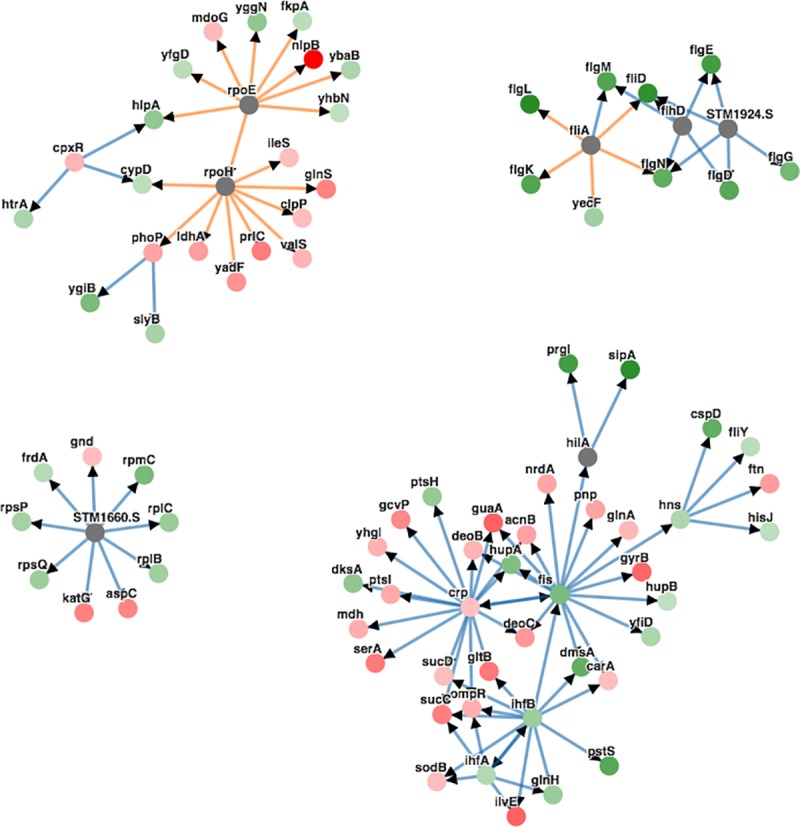
78 out of 192 differentially expressed proteins are shown in the sub-network. Red nodes represent proteins with higher expression in SENT versus STM. Green nodes represent proteins with higher expression in STM versus SENT. The more intense the color, the higher the level of differential expression. Gray nodes have no differential expression. The color of the edge indicates the interaction type with blue referring to metabolic and orange to protein-DNA interactions.