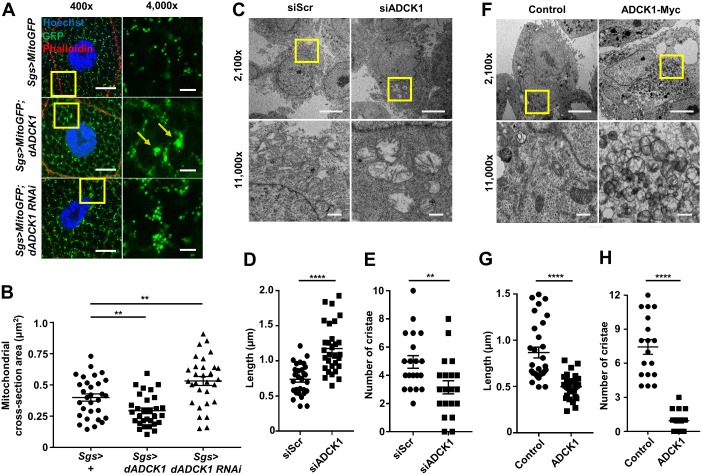
Fig 5. ADCK1 controls mitochondrial structures.
(A) Fluorescent confocal microscopy images for the salivary glands of the third instar larvae with indicated genotypes. MitoGFP (green) shows mitochondria and phalloidin (red) staining indicates the cell boundary. Hoechst (blue) was used for nuclei staining. Scale bars, 20 μm (400×) and 5 μm (4,000×). Boxed areas were enlarged as shown on the right panels. Arrows direct clustered mitochondria. (B) Comparison of the mitochondrial cross-section area in the salivary glands of the third instar larvae with indicated genotypes. n = 30. **, p<0.01 by unpaired t-test. (C) TEM images of HeLa cells transfected with scramble siRNA (Scr) or siADCK1 as indicated. The boxed areas were enlarged in the bottom panels. Scale bars, 5 μm (2,100×, top) and 500 nm (11,000×, bottom). (D) Comparison of the mitochondrial length in HeLa cells transfected with siScr or siADCK1. n = 30. ****, p<0.0001 by unpaired t-test. (E) Comparison of the number of mitochondrial cristae in HeLa cells transfected with siScr or siADCK1. n = 20. **, p<0.01 by unpaired t-test. (F) TEM images of HeLa cells expressing empty vector or ADCK1-Myc as indicated. Scale bars, 5 μm (2,100×, top) and 500 nm (11,000×, bottom). The boxed areas were enlarged in the bottom panels. (G) Comparison of the mitochondrial length in controls and HeLa cells transfected with ADCK1. n = 30. ****, p<0.0001 by unpaired t-test. (H) Comparison of the number of mitochondrial cristae in controls and HeLa cells transfected with ADCK1. n = 18. ****, p<0.0001 by unpaired t-test.

