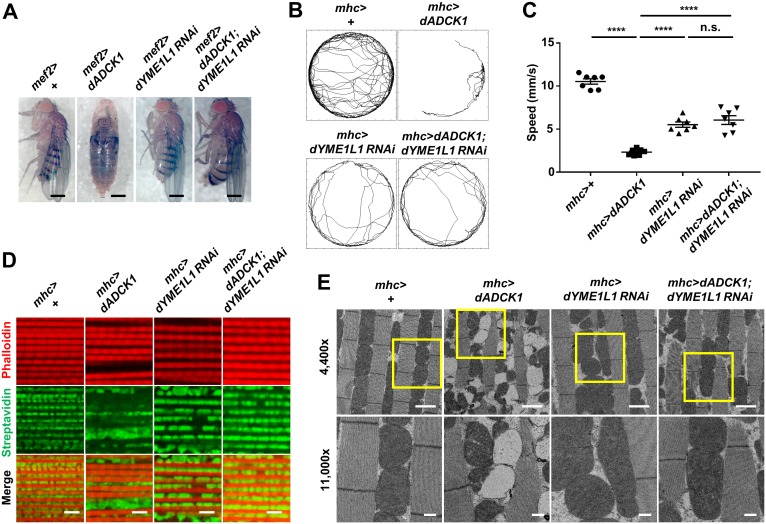
Fig 6. YME1L1 is a target of ADCK1.
(A) Whole body images of the flies with indicated genotypes. Scale bars, 0.5 mm. (B) Movement trajectories of the adult flies with indicated genotypes. (C) Comparison of the means of walking speed for the flies with indicated genotypes, n = 7. ****, p<0.0001; n.s., not significant by unpaired t-test. (D) Fluorescent confocal microscopy images of the adult fly thoraces with indicated genotypes. Streptavidin (green) and phalloidin (red) staining used to mark mitochondria and muscle actin fibers, respectively. Scale bars, 5 μm. (E) TEM images of adult fly thoraces with indicated genotypes. Scale bars, 2 μm (4,400×, top) and 500 nm (11,000×, bottom). The boxed areas were enlarged in the bottom panels.

