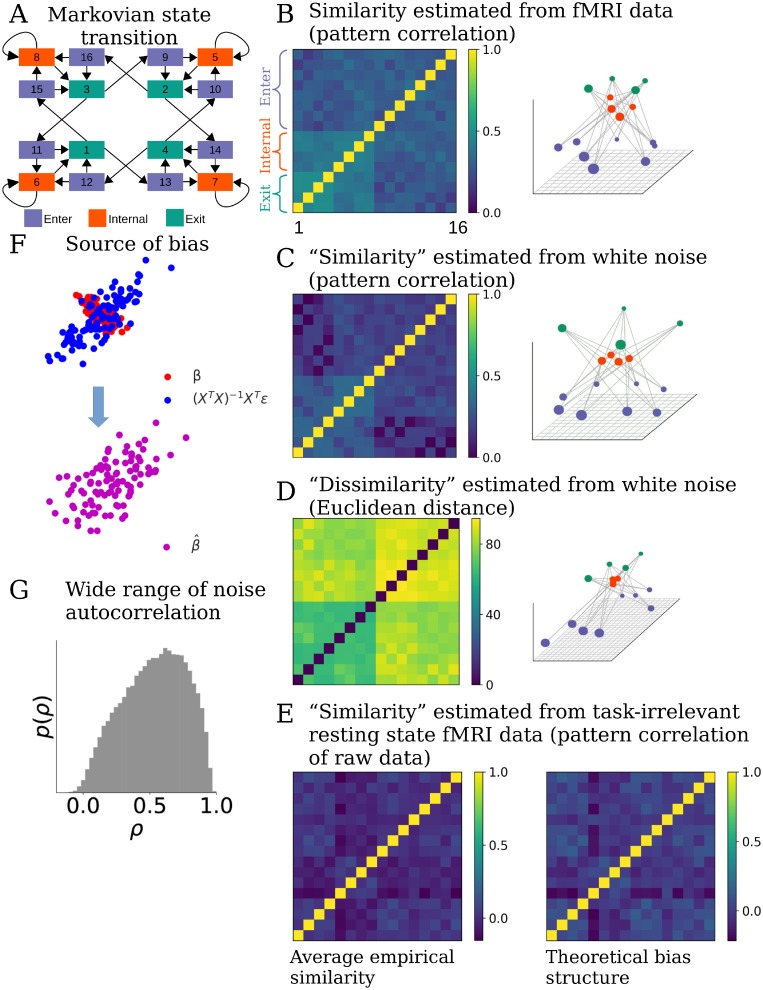
Fig 1. Standard RSA introduces bias structure to the similarity matrix.
(A) A cognitive task including 16 different experimental conditions. Transitions between conditions follow a Markov process. Arrows indicate possible transitions, each with p = 0.5. The task conditions can be grouped into 3 categories (color coded) according to their characteristic transition structure. (B) Standard RSA of activity patterns corresponding to each condition estimated from a brain region reveals a highly structured similarity matrix (left) that reflects aspects of the transition structure in the task. Converting the similarity matrix C to a distance matrix 1-C and projecting it to a low-dimensional space using MDS reveals a highly regular structure (right). Seeing such a result, one may infer that representational structure in the ROI strongly reflects the task structure. (C) However, applying RSA to regression estimates of of patterns obtained from pure white noise generates a very close similarity matrix (left), with a similar low-dimensional projection (right). This indicates that standard RSA can introduce spurious structure in the similarity matrix that does not exist in the data. (D) RSA Using Euclidean distance as a similarity metric applied to patterns estimated from the same noise (left) yields a slightly different, but still structured, similarity structure (right). (E) Calculating the correlation between raw patterns of resting state fMRI data (instead of patterns estimated by a GLM), assuming the same task structure as in (A), also generates spurious similarity structure, albeit different from those in (B-D). This structure is significantly correlated with the theoretical bias structure (details in main text). Left: average of the similarity structure based on raw patterns. Right: average of the theoretical bias similarity structure arising purely from task structure and fMRI noise autocorrelation. (F) The bias in this case comes from structured noise introduced during the GLM analysis. Assuming the true patterns β (red dots) of two task conditions are anti-correlated (the horizontal and vertical coordinates of each dot represent the response amplitudes of one voxel to the two task conditions), regression turns the noise ϵ in fMRI data into structured noise (XT X)−1 XTϵ (blue dots). The correlation between the noises in the estimated patterns is often non-zero (assumed to be positive correlation here) due to the correlation structure in the design matrix and the autocorrelation property of the noise. The estimated patterns (purple dots) are the sum of β and (XT X)−1 XTϵ. The correlation structure between estimated activity vectors for each condition will therefore differ from the correlation structure between the true patterns β. (G) Distribution of the autocorrelation coefficients in a resting state fMRI dataset, estimated by fitting AR(1) model to the time series of each voxel resampled at TR = 2.4s. The wide range of degree of autocorrelation across voxels makes it difficulty to calculate a simple analytic form of the bias structure introduced by the structured noise, and calls for modeling the noise structure of each voxel separately.

