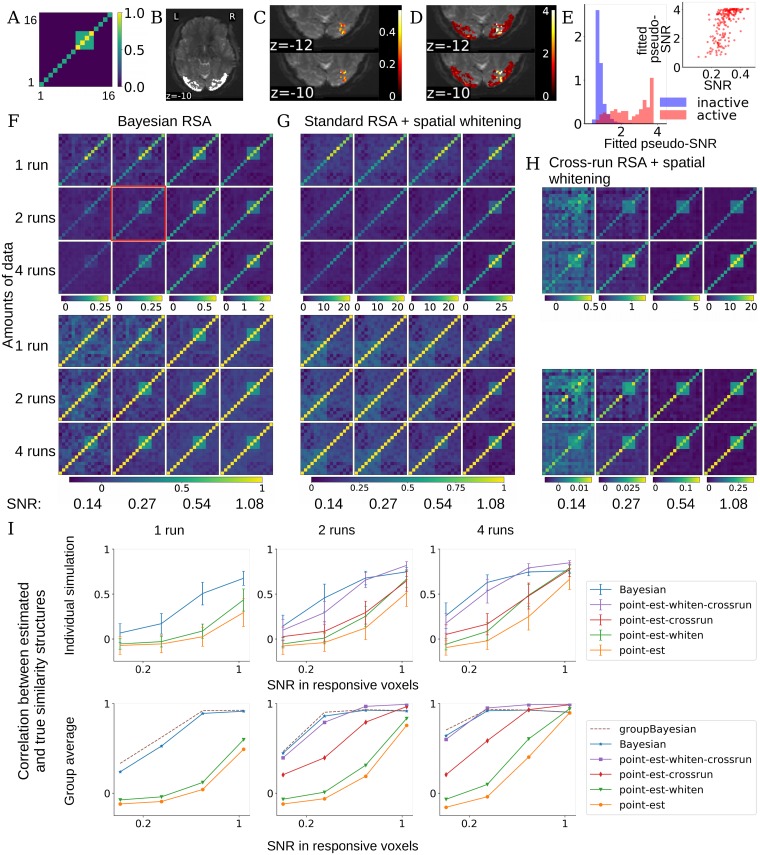
Fig 3. Performance of BRSA and other methods on simulated data.
(A) We simulate task-related activation magnitude according to a multivariate normal distribution with a hypothetical “true” covariance structure U as displayed. (B) We use lateral occipital cortex (bright region) as an example ROI and resting state fMRI data from the Human Connectome Project as noise. (C) We multiplied the design matrix of the task in Fig 1A with the activity pattern simulated according to A and then added this “signal” to voxels in a cubical region of the ROI. The colors show the actual SNR of the added signal for one example simulated brain, corresponding to the plot circumvented by a red square in F. SNR here is defined as the ratio of standard deviation of the simulated signal to that of the noise (the time series of the resting state fMRI data): , where noisek is the time series of the resting state fMRI data in voxel k, treated as task-irrelevant noise in our simulation. (D) The pseudo-SNR map estimated by BRSA for the data with a true SNR map shown in C. The scale does not match the scale of true SNR, but the spatial pattern of SNR is recovered. The result corresponds to the simulation condition with red box in F. (E) The distributions of the fitted pseudo-SNR of task-active (pink) and inactive (blue) voxels are highly separable. The inset shows the SNR in active voxels and their fitted pseudo-SNR are significantly correlated. r = 0.62, p<1.4e-20. (F) Average covariance matrix (top) and similarity matrix (bottom) estimated by BRSA in the cubic area in C, across different SNR levels (columns) and different numbers of runs (rows). The average SNRs within the voxels with signals added (i.e., voxels with color in C) are displayed at the bottom. Note that we do not expect the values in the covariance or correlation matrix to scale linearly with SNR. The major effect of SNR is that the similarity structure becomes noisier as SNR decreases. (G) The corresponding result obtained by standard RSA based on activity patterns estimated within runs, which are spatially whitened. The major effect of SNR is that bias structure is stronger in the result as SNR decreases. (H) The corresponding result of RSA based on cross-correlating patterns estimated from separate runs, which are spatially whitened based on the residuals of all scanning runs. The major effect of SNR is noisier result and smaller correlational coefficients overall as SNR decreases. (I) Top: average correlation (mean ± std) between the off-diagonal elements of the estimated and true similarity matrices, for each method, across SNR levels (x-axis) and amounts of data (separate plots). Bottom: The correlation between the average estimated similarity matrix of each method (for GBRSA, this is the single similarity matrix estimated) and the true similarity matrix. “point-est”: methods based on point estimates of activity patterns; “-crossrun”: similarity based on cross-correlation between runs; “-whiten”: patterns were spatially whitened.

