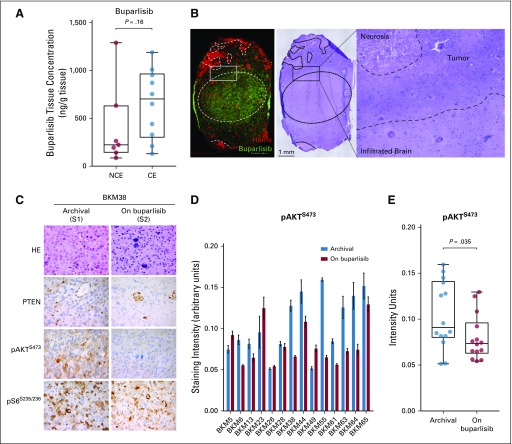
FIG 2.
Buparlisib pharmacokinetics and phosphatidylinositol 3-kinase pathway modulation as a result of buparlisib in tumor tissue in cohort 1. (A) Box plots of buparlisib concentration in non–contrast-enhancing (NCE) and contrast-enhancing (CE) tumor tissue assessed by liquid chromatography-tandem mass spectrometry. Difference between groups was calculated using the Mann-Whitney U test. (B) Histopathologic and matrix-assisted laser desorption/ionization-mass spectrometry imaging drug analysis on stereotactically registered specimens collected from a patient in cohort 1 treated with buparlisib. Image on the left demonstrates location of buparlisib (green) and vessels as measured by heme (red). Hematoxylin and eosin (HE) staining of the corresponding tissue. Outlined area delineates tumor and adjacent infiltrated brain parenchyma. (C) Representative microscopy images of the HE staining and PTEN, phosphorylated AKT (pAKT), and phosphorylated S6 (pS6) in tumor samples collected at baseline and on buparlisib treatment from a patient in cohort 1. (D) Quantification of pAKT immunohistochemistry (IHC) staining intensity in the surgical cohort. Data are mean ± SEM (n = 5 to 7 replicates for each sample). (E) Box plots of mean pAKT IHC staining intensity in the archival and resected tissues from the surgical cohort (n = 14). Difference between groups was calculated using the Wilcoxon test (See Appendix).

