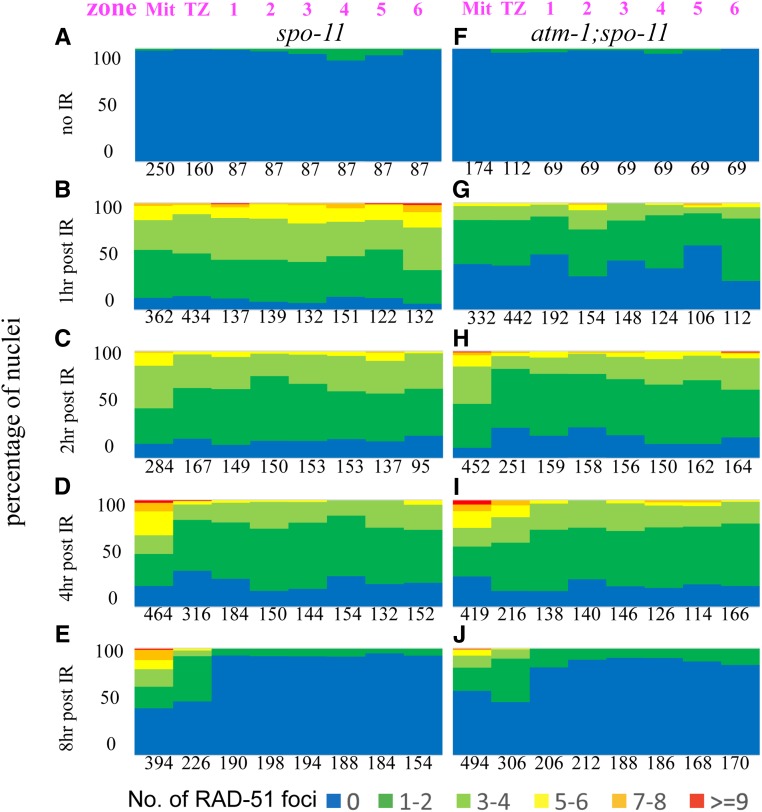
Figure 3.
Loading of RAD-51 is delayed in atm-1 mutants. For each region, the percentage of nuclei with a given number of RAD-51 foci is shown as a heat map from 0 to >9, as indicated below. Zones are shown in Figure 2A. # = nuclei scored/3 germ lines/genotype. (A–E) spo-11 mutants. (F–J) atm-1;spo-11 mutants. Shown in a time-course post-exposure to 10 Gy IR (A and F): unirradiated controls (B and G): 1 hr post-exposure shows reduced loading in atm-1;spo-11. (C and H): 2 hr and (D and I): 4 hr post-exposure loading is almost indistinguishable between control and atm-1;spo-11. (E and J): 8 hr post-exposure, most RAD-51 foci have been removed in the meiotic region of the germ line. We note that repair in the mitotic region is resolved with distinct kinetics.

