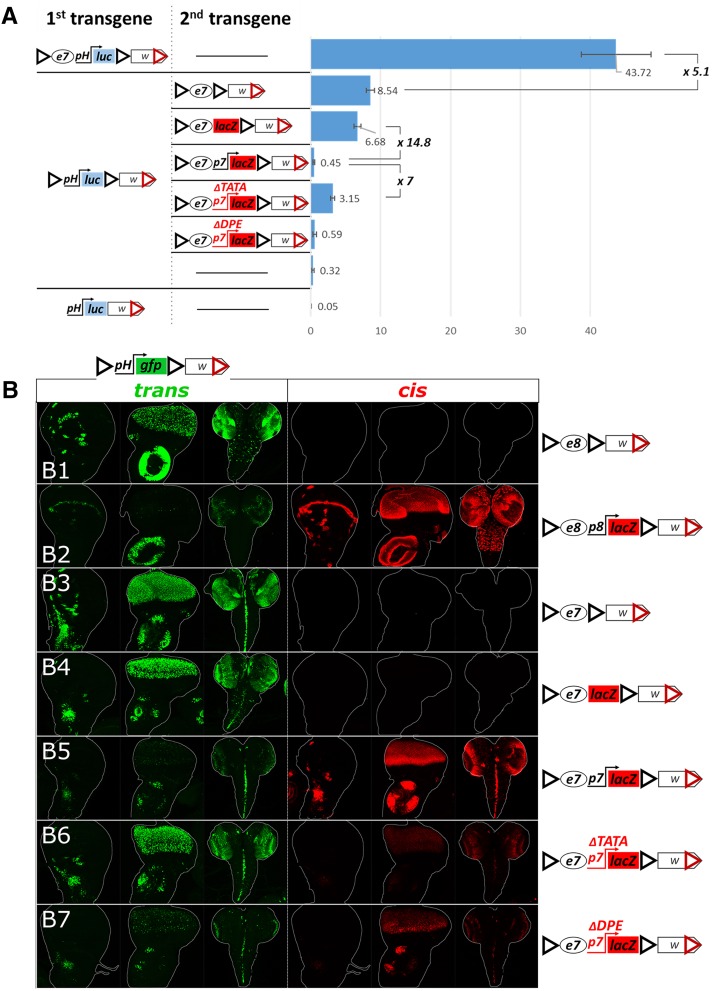
Figure 6.
Regulation of GI-mediated transvection by cis-preference. (A) The chart shows levels of basal and e7-induced (in cis and in trans) pH-driven luciferase activity. Levels of luciferase activity were measured from third instar larval disk-brain complexes. Luciferase values normalized to total protein are shown as arbitrary units (a.u.). The mean and SD of five replicates is shown. The activity of luciferase transgenes (first column in the construct panel) is assayed on their own (as hemizygotes; horizontal line in the second column) or in combination with a second transgene in trans. (B1–B7) Transgenes containing e8 or e7, with or without a cis-linked promoter (depicted on the right), were placed in trans to pH-gfp. For each genotype (each row) the third-instar wing disk, eye disk and CNS were examined for (1) GFP expression (green), reflecting trans activity of the enhancer-containing transgenes on pH-gfp and (2) β-galactosidase expression (red), reflecting cis activity of the enhancer-linked promoter, when lacZ is present. All transgenes contain GIs and mini-white and are inserted in attP40.

