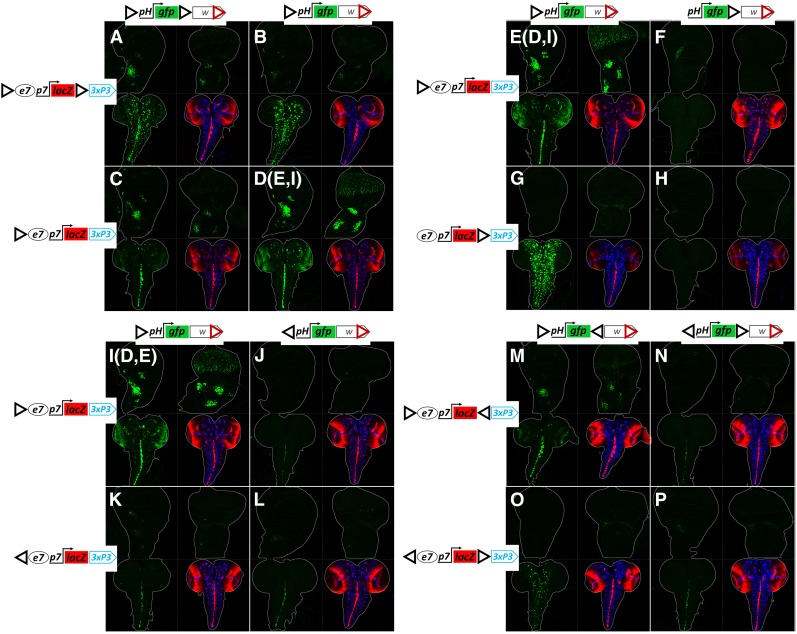
Figure 7.
The relative position, number, and orientation of GIs determine transvection effects. (A–P) Confocal z-projection of GFP expression in third instar larval wing disk (top left panel for each genotype), eye disk (top right), and CNS (bottom left). Bottom right shows the merged e7p7-driven LacZ (red) and 3xP3-pH-driven, DsRed expression (blue) in the same CNS as the bottom left panel; for patterns of e7p7-lacZ expression in disks, see previous figures (Figure 2, Figure 3, Figure 4, and Figure 6); 3xP3-pH-dsRed shows no expression in third instar imaginal disks. Each genotype contains a pH-gfp transgene with mini-white in trans to an e7p7-lacZ transgene with 3xP3-dsRed and various arrangements of GIs (black triangles), as indicated. Note that (D, E, and I) represent different samples obtained from the same genotype. All transgenes are inserted in attP40.

